The market has seen a lot of finishes near the top of its daily range lately. When the market consistently closes near the high of the day it suggests optimism on the part of traders. This end-of-day optimism is now at a level that suggests it is overdone and there is a good chance of a pullback. The study below was last seen in the 1/16/13 blog and it exemplifies this concept. I have updated all of the statistics.
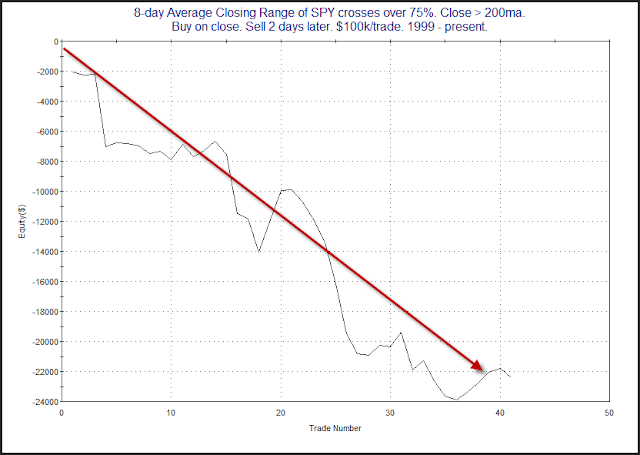
While the downside edge appears to remain in place for a full week, most of the edge has been realized over the 1st 2 days. Below is an equity curve showing how the edge has played out using a 2-day exit strategy.
The strong downslope appears to confirm the bearish edge, even with the action of the last few instances.
Note: To calculate the “8-day Average Closing % Range” I am simply measuring where in the daily range SPY closed each day. For instance if it traded at a low of $146.00 and a high of $147.00 and closed at $146.75, then it would have closed in the 75th percentile of the daily range. A close at $146.50 would have meant 50%.
I then take a simple moving average of the last 8 days. If that average goes from below 75% (where it usually is) to above 75%, the study is triggered.


