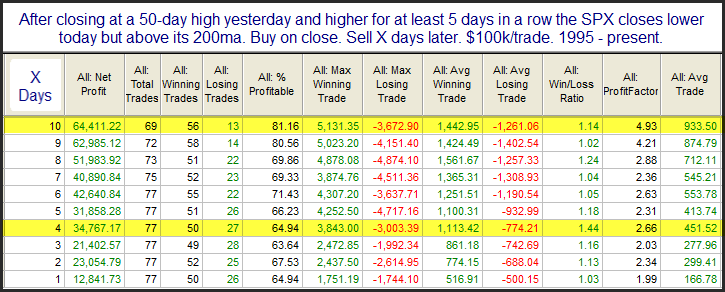
I have not posted many price-action studies to the blog lately, so I thought I would share this one from last night’s subscriber letter. A theme I have seen many times over the years is that persistent uptrends don’t often end abruptly. The study below is an example of this. It considers what happens after the market moves up at least 5 days in a row to a 50-day high, and then pulls back.

We see here a decent edge that becomes stronger and more consistent as you look out over the next several days. Short-term overbought in a downtrend can be a warning sign, but short-term overbought in a strong uptrend often suggests further strength.
Want research like this delivered directly to your inbox on a timely basis? Sign up for the Quantifiable Edges Email List.
How about a free trial to the Quantifiable Edges Gold subscription?
