One indicator that has gotten some play in the news lately is the Hindenburg Omen. In last weekend’s subscriber letter I discussed the Hindenburg Omen signal in detail. (Click here for a free trial.) A core premise behind the Hindenburg Omen is that there are a large number of stocks hitting both new highs and new lows. This indicates a split market. When this has happened for multiple days within a short time period, it has often led to market declines. Friday marked the 9th day in a row that NYSE new highs and new lows both exceeded 2.4% of total issues traded. The study below is from the Thursday night subscriber letter, and it looked at streaks of 8 days or more. (I’ll note I also took a quick look this weekend at streaks of 9 days, rather than 8. It barely changed anything.)
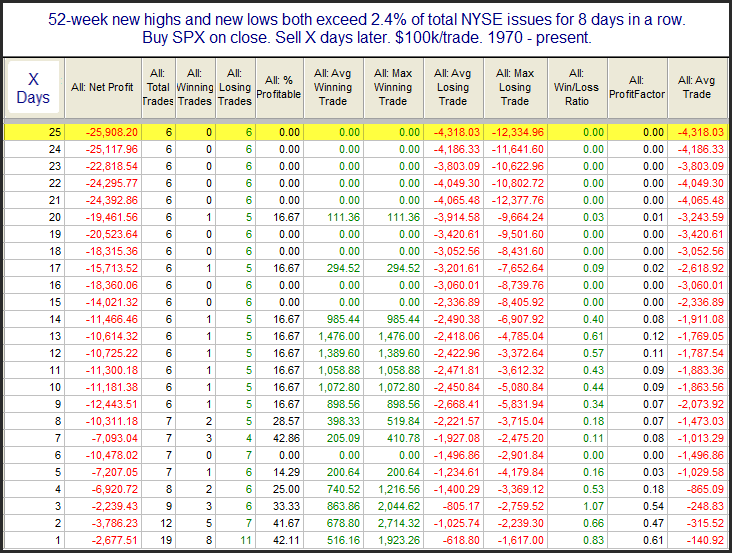
… But tonight I simply wanted to look at streaks of these type of split market conditions on their own. With data going back to 1970, I looked for other instances of 8 consecutive days with both new highs and new lows exceeding 2.4% of total issues. Results are below.

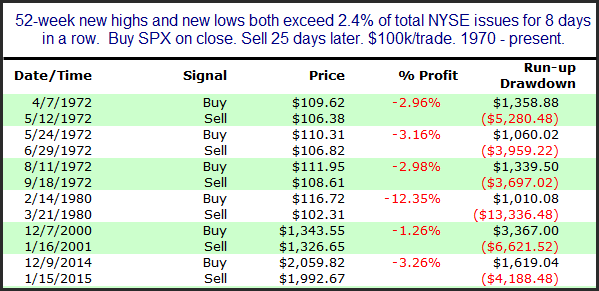
There have not been many instances, but the returns after the ones so far have been quite bearish. Below is a list of all the instances assuming a 25-day holding period.

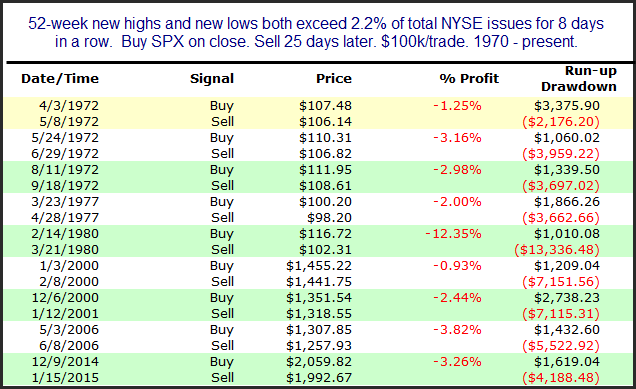
Three of the six instances occurred in 1972. So with just 3 instances since 1972, I am not using this study to generate short-term expectations. But I thought results were intriguing enough to merit a mention. I also reduced the % requirement to see if that would provide some additional instances. Below are the 25 day-results for a 2.2% minimum.

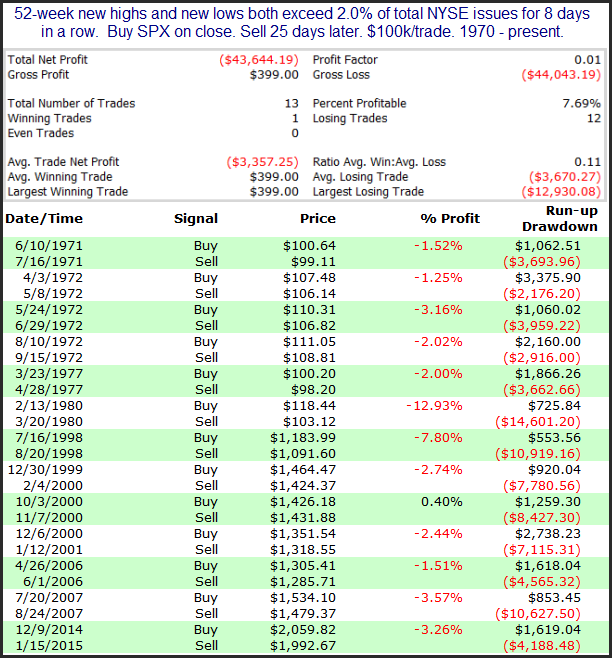
This does not look any better. How about a 2.0% requirement?

Even the lone winner here had an 8.4% decline before turning slightly positive. Bottom line appears to be that having such a split market as we are currently seeing is quite rare. And historically it has not been a good thing for the market.
Want research like this delivered directly to your inbox on a timely basis? Sign up for the Quantifiable Edges Email List.
