With my beloved Celtics on late tonight I likely won’t have time to post. So here’s a little mid-day study for you.
Since early April the Nasdaq has been a leading index. Net new highs have failed to expand, though. According to my data provider, they peaked at 64 on May 2nd. The last few days there have been significantly more new lows than new highs. If you take the net difference and divide it by the number of stocks trading on the Nasdaq your result for Tuesday and Wednesday was less than -1%. (Wednesday: 53 new highs – 93 new lows = -40 net / 3030 issues = -1.32%). Coming off a 4-month (80 day) high this is an unusual occurrence.
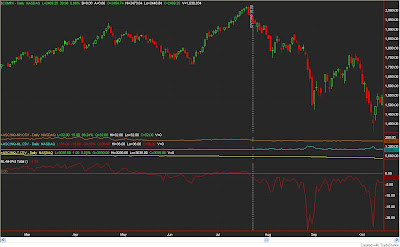
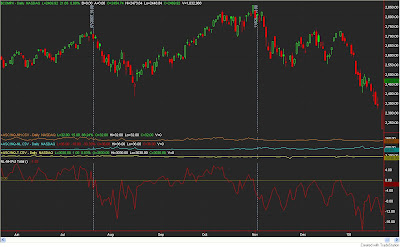
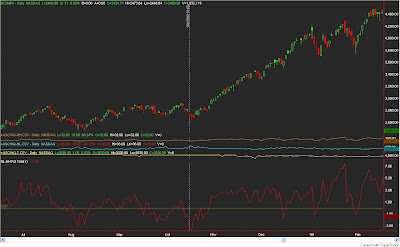
I looked back to 1994 (as far back as I had the data) to see if I could find other times where the Net New High Percentage ratio closed below -1% twice within 3 days of an 80-day high. I found three other dates 7/23/98, 7/20/07, and 11/02/07. Charts below (click to enlarge):


