This past week was the 4th week in a row that the SPX declined. It is quite unusual to see SPX close down for 4 weeks in a row, but still remain above its 40-week moving average. Below is a look at other times since 1975 that this action has occurred.
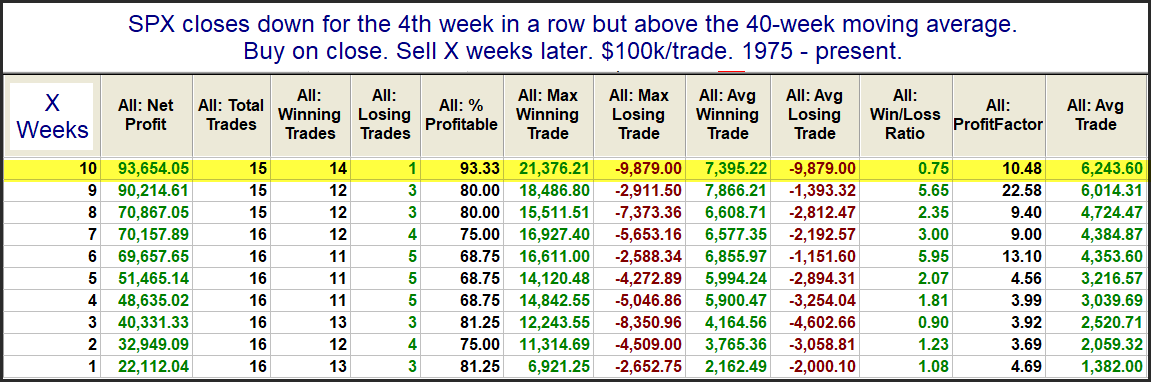
These results are suggestive of an upside edge over the next several weeks. Below I have listed all 15 non-overlapping instances using a 10-week exit strategy.
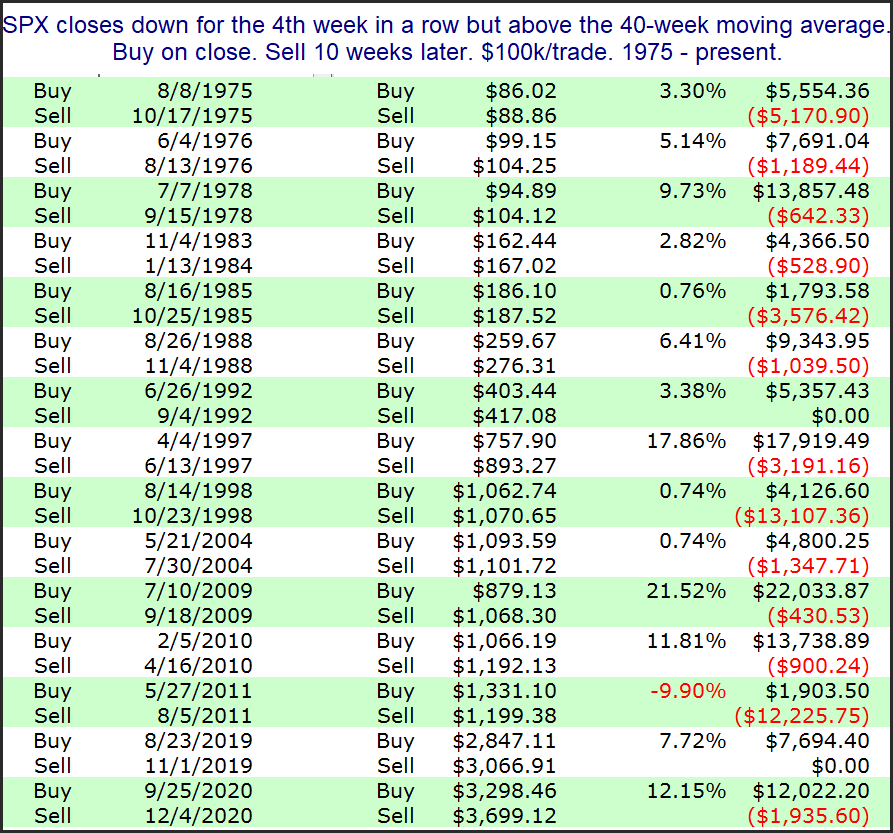
The 2011 instance did not work out at all. Most everything else looks encouraging. Based on this narrow look, it appears we are reaching a point where an SPX rally might be expected in the coming weeks.
Want research like this delivered directly to your inbox on a timely basis? Sign up for the Quantifiable Edges Email List.
How about a free trial to the Quantifiable Edges Gold subscription?