
With tonight being the State of the Union Address I decided to take another look at an old study that examined SPX performance following past speeches. The data table below looks back to 1982. There were a few instances, such as 2001 and 2009 where the speech was not an official “State of the Union”, but was delivered under a different name. I have included those speeches in the results as well.
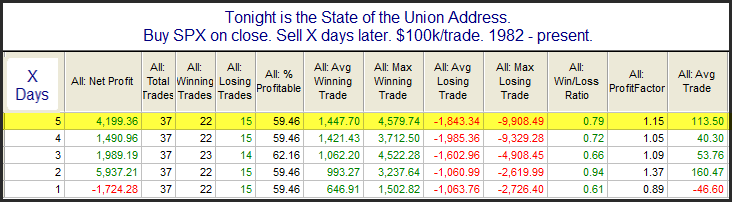
The stats do not suggest much of an edge. But the profit curves seem to tell a more interesting story. Here is the 5-day curve.
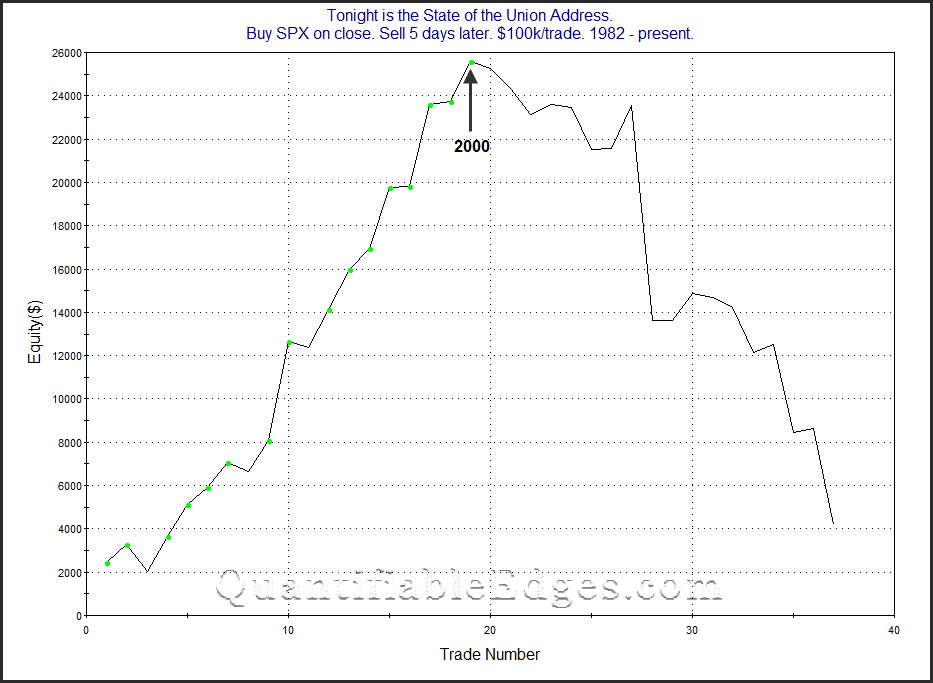
All the curves look something like this in that since the turn of the century the market has tumbled after these speeches rather than been inspired by them. I guess they just don’t write speeches like they used to.
Want research like this delivered directly to your inbox on a timely basis? Sign up for the Quantifiable Edges Email List.
