I’ve been asked many times what I believe has been my key to success as a trader. My answer normally is “I always test out my ideas. I never believe anything I read… Even if I wrote it.” It sounds funny but it is true. The tool I use to help me identify edges I have published in the past is the Quantifinder. But when I do my nightly analysis and write my letter I don’t just refer back to a study I published 3 years ago and assume it is still providing the same edge. I retest it. Every time. With this in mind…
Both Wednesday and Thursday of this week we saw very strong and persistent buying in the 1st half hour of trading. In fact, neither day saw a single negative TICK reading for the entire 1st 30 minutes. There was a time when this kind of buying would almost certainly create a pile-on situation and the market would continue to rally throughout the day, only ever pulling back moderately, and finishing the day near its highs. Dr. Brett Steenbarger, who used to write the excellent Traderfeed blog (and several books), often referred to these kind of days as “Trend Days”. He wrote several posts on them. He would say that the key to profiting from a Trend Day is to identify it early and then jump aboard. If you fight a Trend Day by trying to short the highs you will keep getting run over.
Strong early TICK action was one clue that a Trend Day might be forming. But in recent years it has become very unreliable. Let’s look at some studies to see what I am saying.
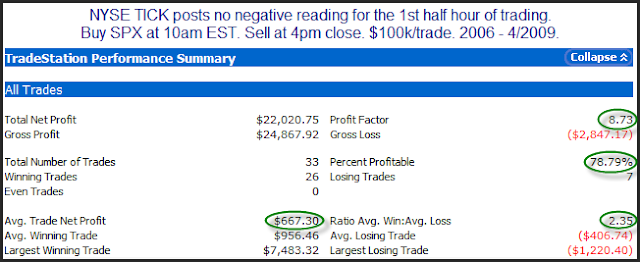
The study below shows how strong early TICK action (no negative TICK reading in 1st 30 minutes) suggested a strong upside edge for the rest of the day. The period studied is 2006 – 4/2009.
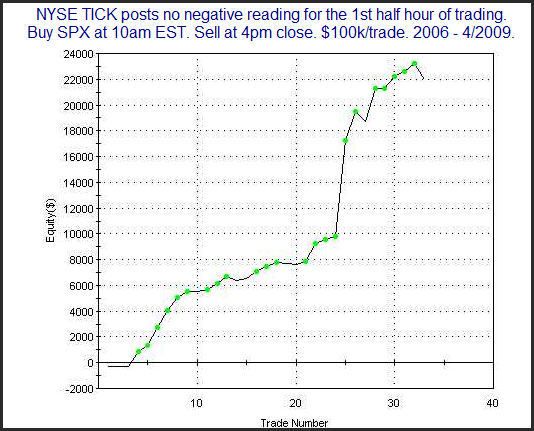
Pretty awesome stats all around. Now let’s look at a profit curve.
While that one trade in the middle gave an extra-large boost you can see that new highs were made continually throughout the curve. Overall, this appears to be a very appealing edge.
But now let’s look at the period from May 2009 through the present. Same setup.
Over the last 26 instances it appears there has been no discernable edge. Let’s see how the profit curve looked over this period.
Very inconsistent. A few minor streaks. Not an appealing curve in the least.
What’s this mean? A few thoughts:
First the obvious: if you are an intraday trader and you look to play Trend Days, then you are hopefully aware before reading this that some of the old identifications tools are not working as well lately. Don’t get caught in reversals like those that occurred the last 2 days.
For everyone – something changed that eliminated this edge. I don’t know what. It isn’t my job to know what changed. And I don’t care the reason. I’m only interested in being aware when it happens so that I can adjust my strategies. And no matter what your timeframe you must keep in mind that the market is always changing. Identifying those changes and adjusting to them is vital for long-term success as a trader.
Traders don’t all need to quantify everything as I do. But identifying changes and understanding what is working and what is not is important. You must constantly adapt to stay in business. Early morning TICK strength is just one example of environmental change. The longer you trade the more examples you will see. So trade with an open mind. Take advantage of market behaviors while they last. When the market begins to behave in a different way, adapt. Stay in business.


