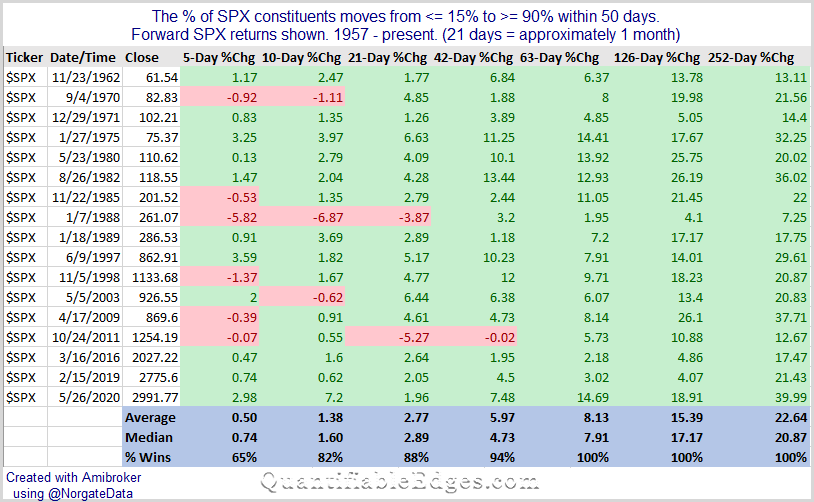
A couple of weeks ago on Twitter I shared a breadth thrust study that looked at times the % of SPX stock above their 50ma quickly rose from <= 15% to >= 90% within 50 days. The results I shared can be found below.

I noted the following in the letter after examining the results…but this appears to be yet another breadth study that we can add to the growing list suggesting an upside edge over the intermediate-term. Of the 17 instances that triggered since 1957, all of them saw the SPX higher 3, 6, and 12 months later.
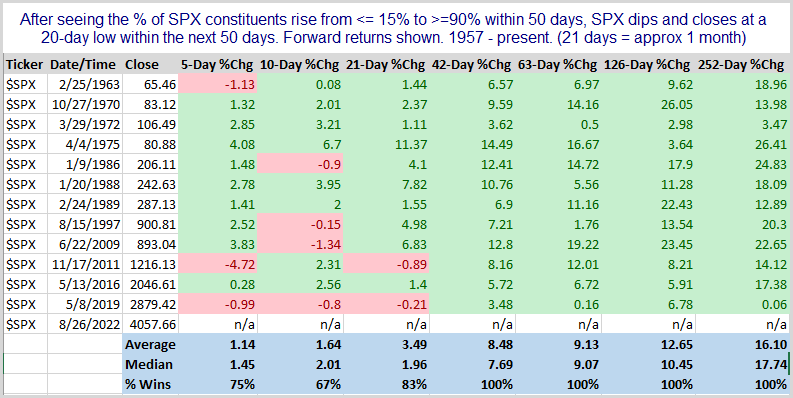
I have received some questions and seen some discussion on Twitter about whether the recent tumble the market has taken meant the end of the breadth thrust signal. So I looked at it a couple of ways. I noted that Friday’s selloff caused the SPX to close at a 20-day low. I then looked at other times the market quickly reversed and posted a 20-day closing low after seeing a breadth thrust like those above.

There were only 3 instances that saw such a quick dive to a 20-day low after posting a similar breadth thrust. I never like to read anything into just 3 instances. So I expanded the time period to note any instance that closed at a 20-day low within 50 days. Those results are below.

Still just 12 instances, but also still no indication that the pullback would suggest the original study has been invalidated by the recent drop. While there are bearish studies and indicators out there, I see no good reason to throw out the original breadth study. Other instances where there have been pullbacks to 20-day lows after similar breadth thrusts have all been followed by gains 2, 3, 6, and 12 months later.
I will note that I did see a “breadth collapse” study that triggered last week suggesting more downside over the next month. I wrote about that in the subscriber letter. (You may take a free trial here if you wish to see it.)
So while the 50ma breadth thrust study still appears to be a positive looking out over the longer time-frames, there is contrasting evidence for the intermediate-term. Overall, that leaves breadth readings somewhat questionable. Perhaps we will see more clarity in the weeks to come.
Want research like this delivered directly to your inbox on a timely basis? Sign up for the Quantifiable Edges Email List.
How about a free trial to the Quantifiable Edges Gold subscription?
