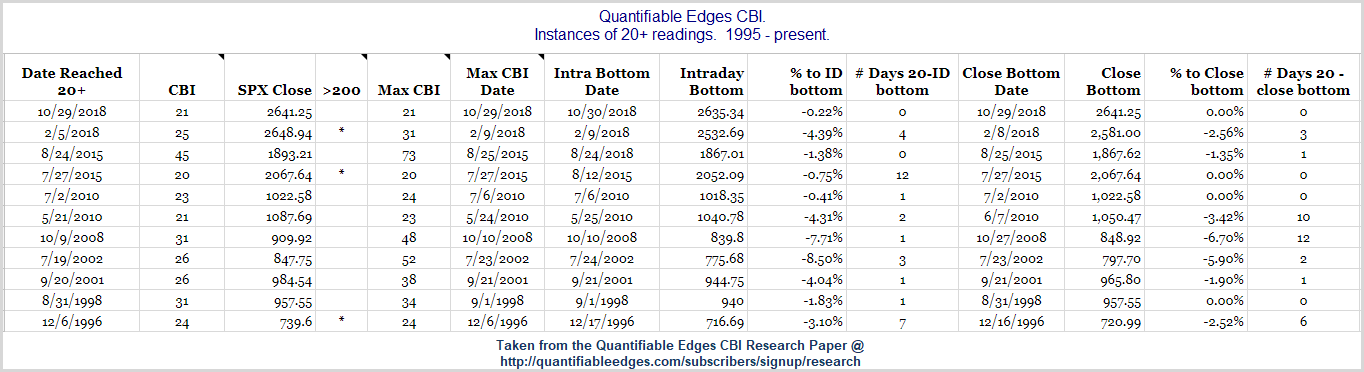
The Quantifiable Edges Capitulative Breadth Indicator hit 20 on Friday. That is just the 12th time since 1995 that the CBI reached that high. A very high CBI reading implies that there is a substantial number of stocks that are undergoing capitulative selling and primed for strong reversals. A high CBI can also act as a signal that the market is about to bounce. The table below is taken from the CBI Research Paper. It examines all 11 previous instances, how long it took before an intraday and a closing bottom was reached, and what level marked the peak CBI for each instance.
To learn more and see charts for all of these instances, you can download the CBI Research Paper (free). Instructions on how to do so can be found here.
Want research like this delivered directly to your inbox on a timely basis? Sign up for the Quantifiable Edges Email List.