The Quantifiable Edges Capitulative Breadth Index (CBI) rose up and closed at 12 on Monday afternoon. Discussion of the CBI has been fairly regular over the years here at Quantifiable Edges, but for those that are new or would like a refresher, a detailed description of the CBI can be found here. Or if you want to review past studies I have published on the indicator click here for more research related to the CBI..
The CBI measures the number of signals among S&P 100 stocks for my Catapult System. While the system is proprietary, I have used it since mid-2004 and published all the signals in the Quantifiable Edges Subscriber Letter real-time since the letter’s inception in 2008. The basic idea is that the more capitulation selling that is evident among individual stocks, the more likely it is that the market as a whole is capitulating and primed for a bounce.
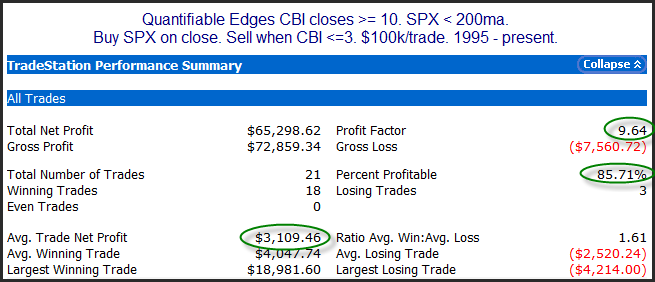
While the record has not been perfect, it has been extremely good, and it has helped me to identify many high-probability trades during over-emotional market periods. The study below is one I have shown in the past. It examines CBI readings of 10 or higher while the SPX is under its 200-day moving average. Ten has been a level I have often referenced where the reading is getting relatively high and the market is typically within a few days of a bounce. Three or lower represents a CBI reading that I consider market-neutral. The study looks to enter on readings of 10 or higher and exit the market only when the CBI returns to 3 or lower.

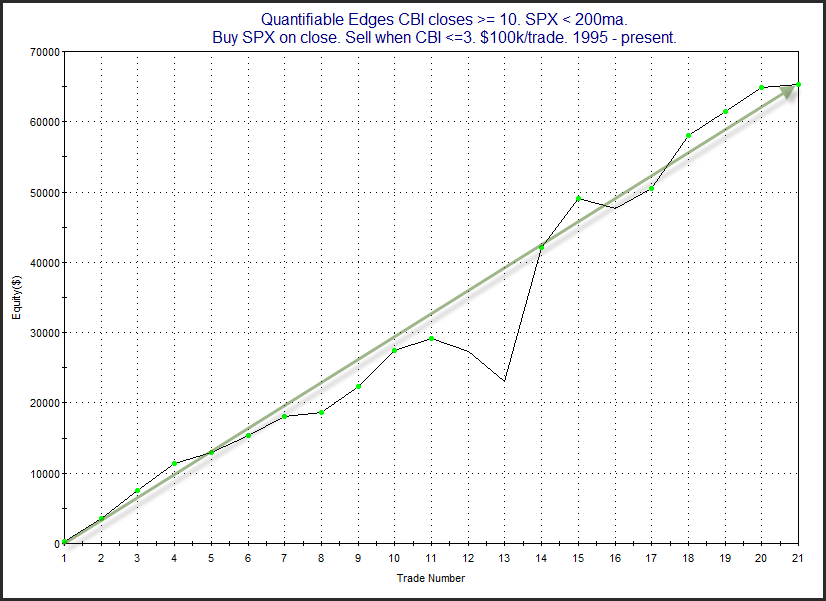
The record is impressive. Below is the profit curve.

The strong persistent upslope serves as confirmation of the upside edge.
I’ll also note that the move in the CBI to 11 or higher has often suggested an intermediate-term edge, not just a short-term edge. In July I posted a study showing how spikes to 11 or higher have typically led to intermediate-term bounces. And measuring out 20 days from the trigger day the market was higher all 23 times from 1995 through early this year. As it turned out the July and August spikes were the first instances since 1995 (as far back as CBI history is available) that did NOT see the market close up 20 days later. But they were not total failures. They both did see bounces over the next few weeks and both were positive as late as 17 days later. They just couldn’t make it to 20.
Want research like this delivered directly to your inbox on a timely basis? Sign up for the Quantifiable Edges Email List.
