Remarkable about Friday’s 50-day high close is that it came just 8 trading days after SPX closed at a 50-day low. That’s quite rare to see. The study below is from this weekend’s Quantifiable Edges Subscriber Letter. It looks at all the instances since 1950 of a move from a 50-day closing low to a 50-day closing high that have occurred within 2 weeks.
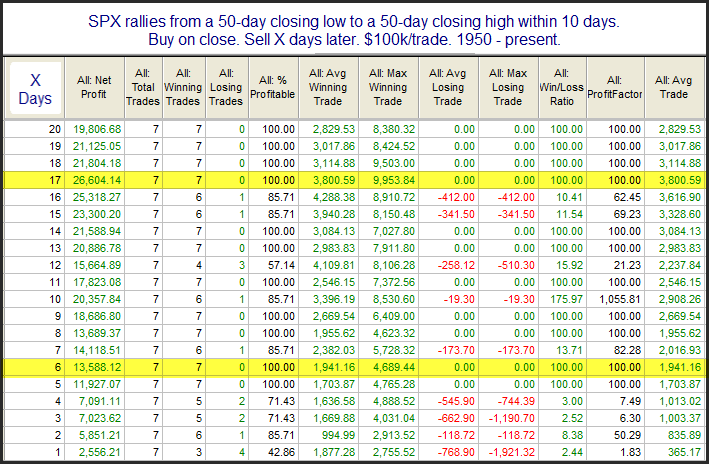
There have only been 7 occurrences but the stats are overwhelmingly bullish over the next month. The profit maxes out on day 17 in the table above. To getting a better feel for the instances I have listed them all below along with 17-day stats.
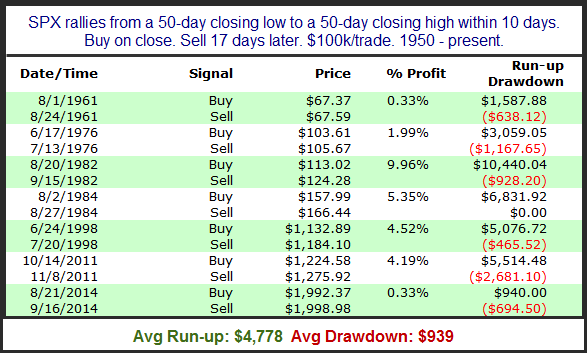
While 7 instances is a bit low, the results are unanimous and the stats above are incredibly lopsided. So it seems this study may be worth some consideration. The average run-up of the 7 instances is over 5x the size of the average drawdown, and every instance saw a run-up substantially larger than its drawdown. That’s impressive.
Want research like this delivered directly to your inbox on a timely basis? Sign up for the Quantifiable Edges Email List.