The January Barometer is a fairly famous study from the Stock Traders Almanac. It says that “as goes January, so goes the year”. In other words, a positive January will typically lead to a positive year, while a negative January can be a warning. Let’s look at how the SPX has done for the remaining 11 months of the year based on how January performed.

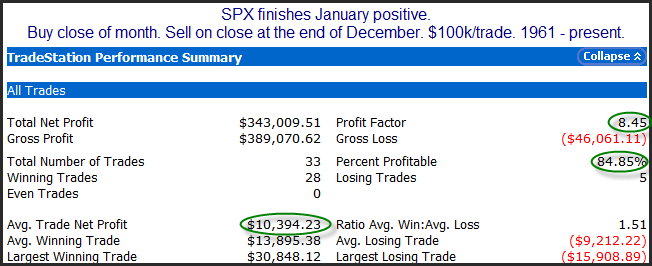
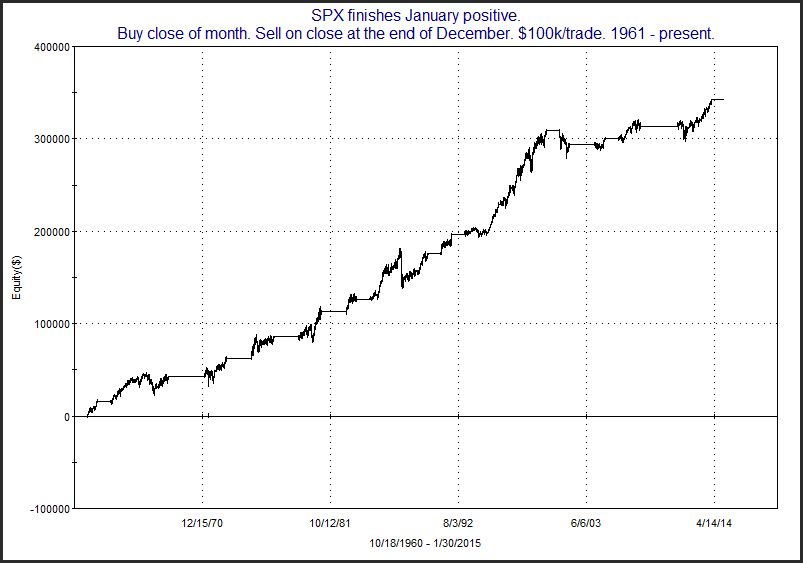
The numbers show that in years that January has done well, the rest of the year has typically fared well also. Below is a profit curve.

That is a nicely steady upslope. Now let’s look at how Feb-Dec has done after a down January.

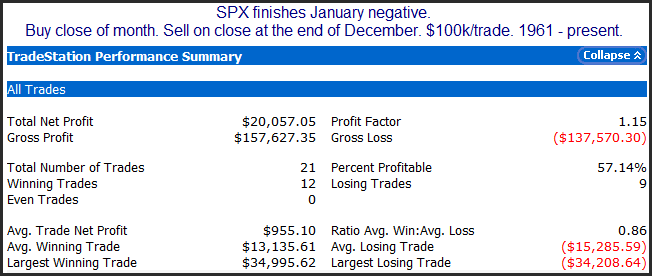
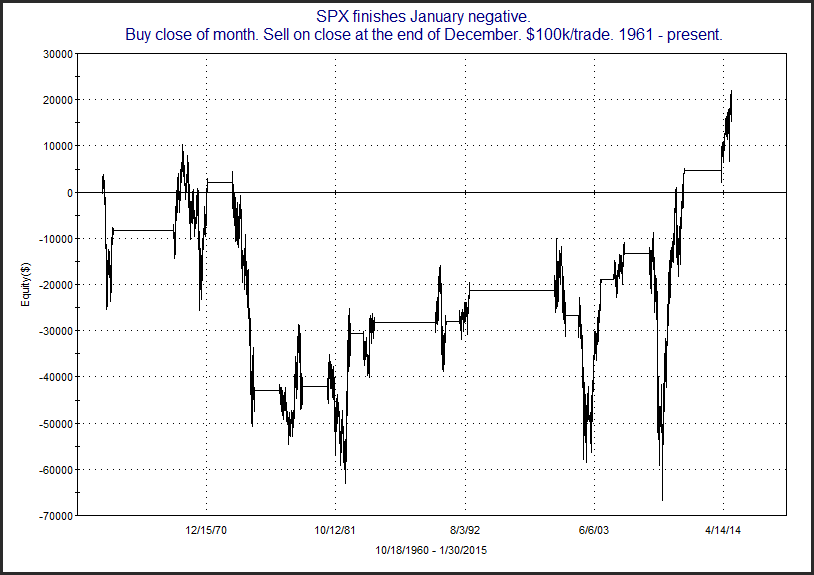
Not as many instances, but there does not appear to be the same kind of bullish tendency here. More of a crapshoot. Below is a curve.

Certainly not a chart to trade off of. So it would have been nice if January finished positive. But it is not a sign of impending doom. Just that we don’t have the kind of momentum that would be preferable.
Want research like this delivered directly to your inbox on a timely basis? Sign up for the Quantifiable Edges Email List.
