A few days ago on X, Charlie Bilello pointed out SPX had gained more than 16% over the previous six weeks and that’s one of the biggest six-week rallies of all time. I looked back at the top 20 non-overlapping 30-trading-day rallies since 1950. They can all be found in the table below.
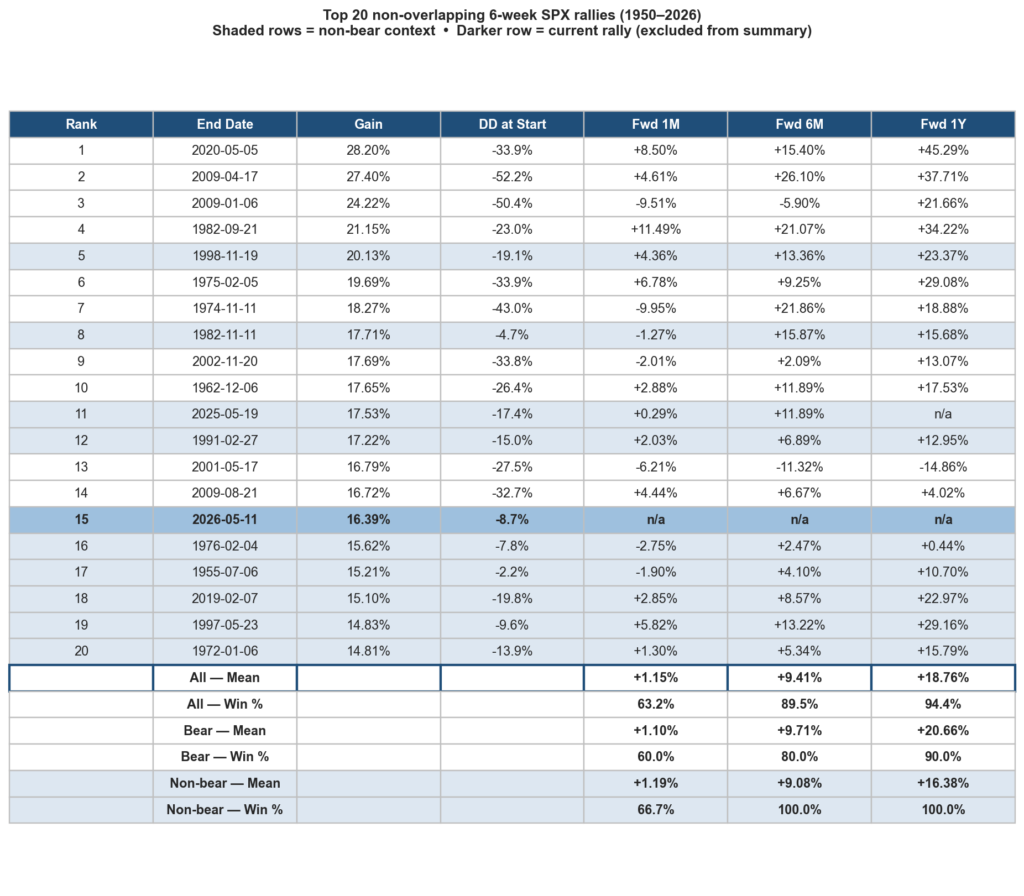
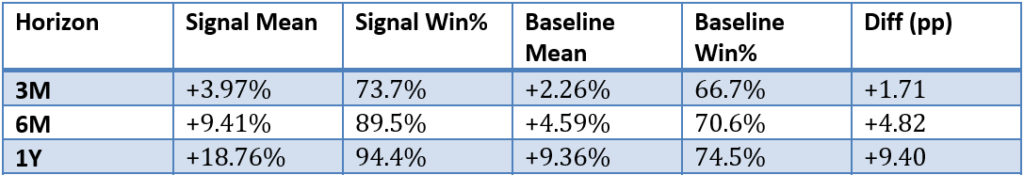
Shaded rows are those instances where there was less than a 20% drawdown at the start of the rally. The current instance saw one of the shallower drawdowns. Only 1955, 1976, and 1982 saw rallies that were not coming out of larger drawdowns than the current one. After such strong rallies whether they were bear or non-bear, the next month generally did not see much progress. But longer-term results were quite impressive. After the 19 prior 6-week rallies, SPX averaged +18.8% over the next year with a 94.4% win rate, versus a +9.4% / 74.5% baseline. Below you can see the signal versus the baseline numbers.
Signal vs baseline forward returns (top 20 rallies)
Lastly a little graphic showing the one-year forward returns after each of the 6-week rallies:
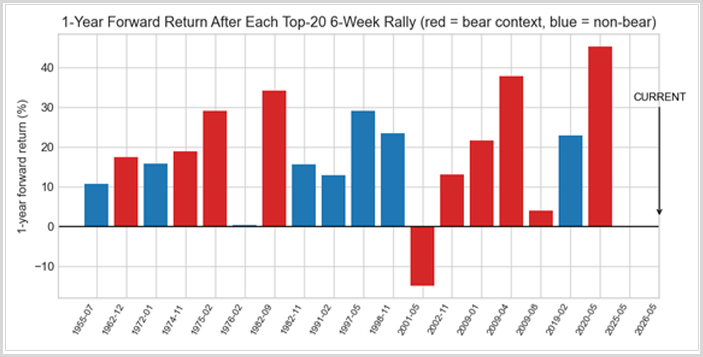
So the momentum over the recent six-week period seems to be positive. We’ve seen this other ways but I thought this was an interesting look. Also impressive is that looking at the eight non-bear instances the average drawdown was only 8.29%, while the average run-up was 18.96%. There are certainly risks out there, but strong moves like we have seen recently tend to be a positive over the intermediate and long term.
Want research like this delivered directly to your inbox on a timely basis? Sign up for the Quantifiable Edges Email List.
How about a free trial to the Quantifiable Edges Gold subscription?