I believe the 1st time I posted a blog on the “Weakest Week” was 2011. Historically, the week after options expiration has been the most bearish of the year. Since 2011, the downside edge has certainly persisted. Below is a look at SPX performance during this week dating all the way back to 1960.
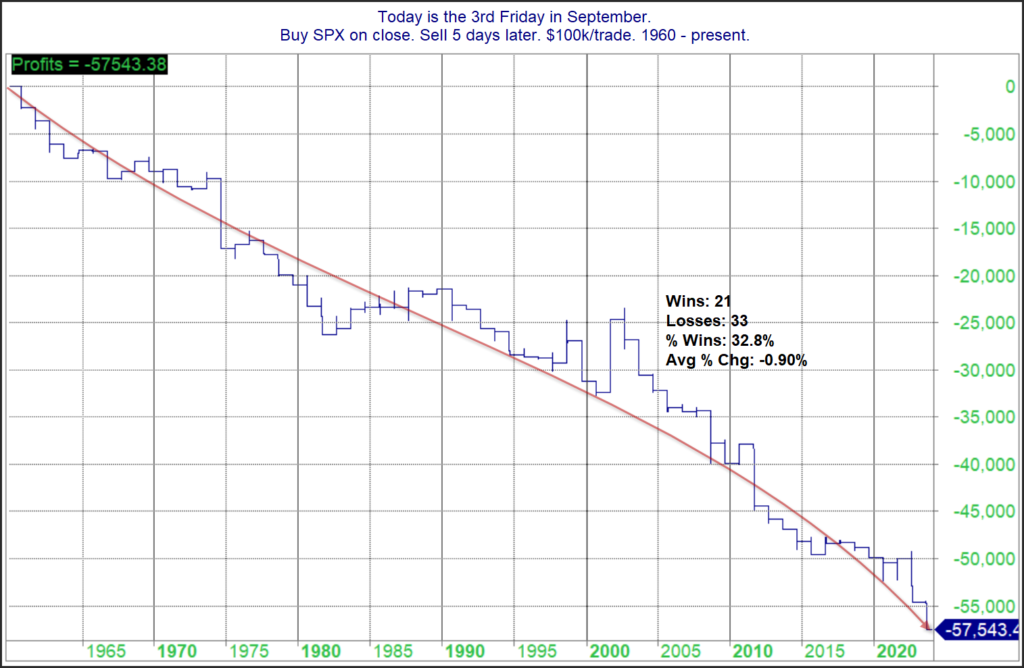
You’ll note the average return this particular week has been -0.9% since 1960. The downward persistency of the curve shows that the bearish tendency has been quite consistent over the last 64 years. There was a stretch in the late 80’s where there was a series of mild up years. Since 1990 it has been pretty much all downhill. Traders may want to keep this in mind this week.
Want research like this delivered directly to your inbox on a timely basis? Sign up for the Quantifiable Edges Email List.
How about a free trial to the Quantifiable Edges Gold subscription?