One indicator that is showing extreme readings lately is the CBOE Equity-Only Put/Call Ratio. It has been coming in very low, meaning options traders have been buying a lot more calls than puts. (Why waste your money on a put when stocks only go up?) Below is a look at the 10-day average of the ratio.
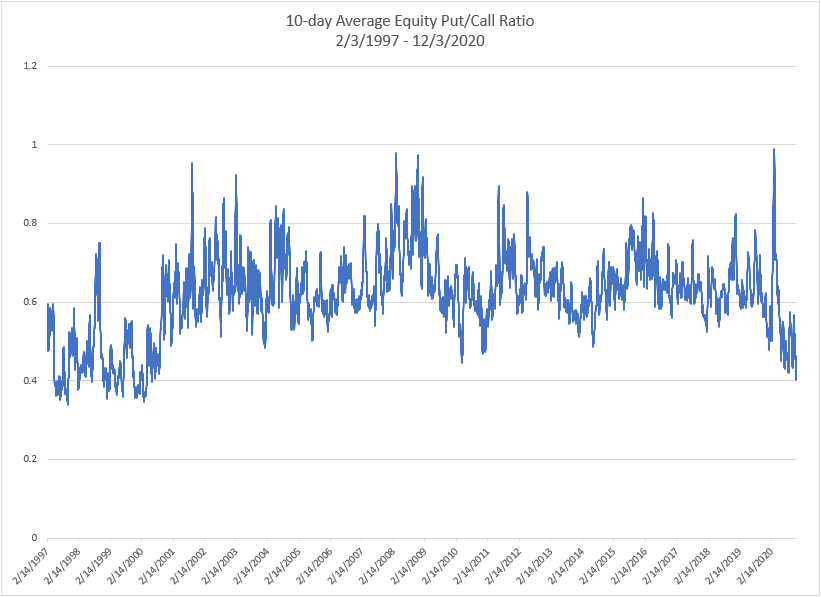
As you can see, we are reaching levels not seen since the late the late 90s and 2000. But it is also notable that such readings were fairly common back then. When I look at P/C Ratios, I will often normalize them, to see how they look vs recent times. A simple way to do this is to divide the 10-day average shown above by the 200-day average. This is what I did in the chart below, and it is shown by the blue line. The orange line is the S&P 500 index.
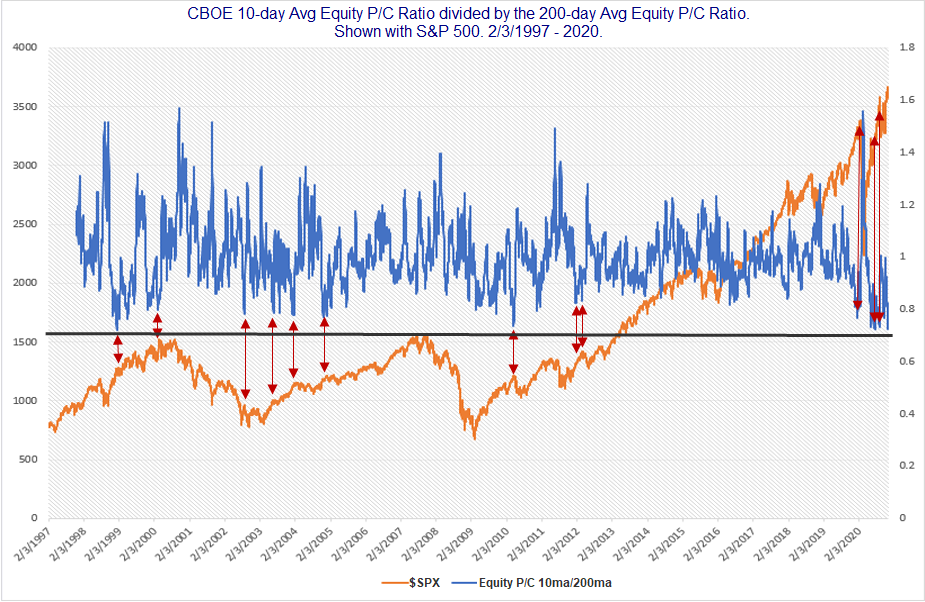
The black line that goes across near the middle of the chart shows that the lowest 10/200 P/C reading, which came on 1/11/99, was just barely below Thursday’s. Thursday’s is the 2nd lowest ever. When readings get this extreme it is difficult to run numbers, because we only have the one other instance to look at. But I drew red arrows at many of the other points where the 10/200ma of the Equity P/C Ratio got near where it is now. As you’ll note, many (not all) of them were soon followed by some short-term selling. That certainly seems to be a danger based on the extreme complacency that options traders are currently showing.
Want research like this delivered directly to your inbox on a timely basis? Sign up for the Quantifiable Edges Email List.
How about a free trial to the Quantifiable Edges Gold subscription?