
What the Stretced VXO is Suggesting

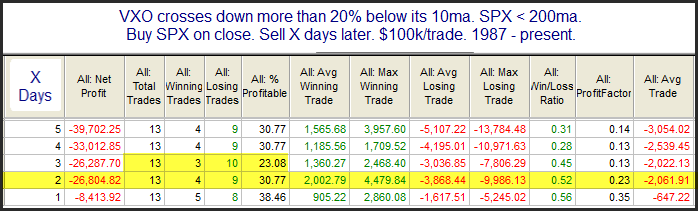
The VIX and VXO have dropped sharply over the last 7 days. These are measures of options premium. When they are falling it means premium is declining, and options traders are less fearful. The study below looks for times when the VXO becomes stretched more than 20% below its 10-day moving average. I have updated all the statistics.
2015-10-08 image1

Reward/risk appears to strongly favor the bears based on the limited sample size. Traders may want to take this into consideration when considering their bias over the next few days.


Want research like this delivered directly to your inbox on a timely basis? Sign up for the Quantifiable Edges Email List.

About the author:

Rob Hanna is the founder of Quantifiable Edges, a quantitative market research service he has run since 2008. His research focuses on statistical analysis of U.S. equity markets. In 2009 he published "The Quantifiable Edges Guide to Fed Days," available on Amazon. He was named the 2024 recipient of the National Association of Active Investment Managers (NAAIM) Founders Award and has since joined the NAAIM Board of Directors. Rob also works with Capital Advisors 360 as an investment advisor representative, where he utilizes quantitative and volatility-based models. Follow him on X / Bluesky / StockTwits / Facebook / Substack