I have spoken a fair amount lately about the “split” market, and how that has historically been followed by declines. But not all kinds of splits are bad. Wednesday we saw the SPX rise while the RUT closed lower. That is not unusual on a 1-day basis. But it has now been several weeks in which they have been heading in opposite directions. RUT closed in the bottom 25% of its 20-day range on Wednesday while SPX closed in the top 25% of its 20-day range. The study below looks at other times where this occurred.
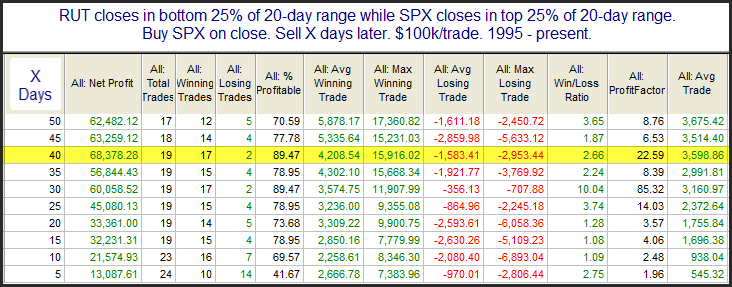
It appears the lagging RUT in similar circumstances has not been a drag going forward, and that SPX has continued to flourish. Below is a look at a profit curve with a 40-day holding period.
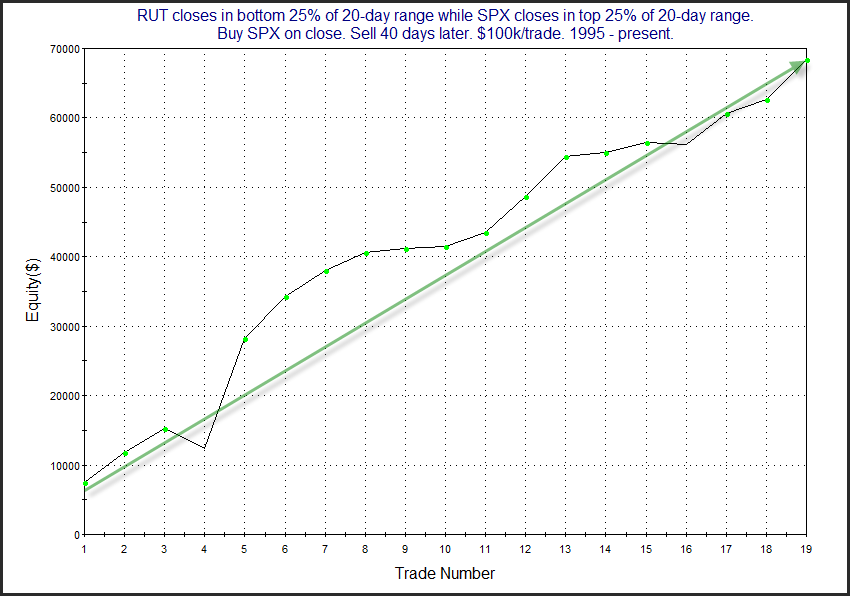
The strong, steady upslope serves as some confirmation of the upside edge. This adds to the crosswinds I am currently seeing for the intermediate-term. Evidence seems to be piling up on both sides of the bull/bear debate. But this study is one for the bulls.
Want research like this delivered directly to your inbox on a timely basis? Sign up for the Quantifiable Edges Email List.