Friday’s rally generated the 2nd 90% Up Volume day within 5 days. In other words, on the NYSE 90% of the reported volume went into securities that closed higher. Last Tuesday we also saw this happen. In the past 2 such days in close proximity has been a positive sign for the intermediate-term. It is something I shared in the subscriber letter over the weekend, and wanted to post to the blog – but did not get a chance until now. With nearly 9 months left in the study and hardly any move on Monday, I thought it was still plenty fresh enough to share. So below is a list of the 9 (non-overlapping) instances and their 9-month performance.
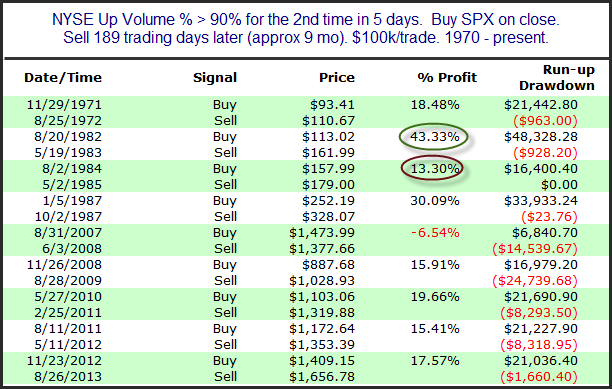
The 2007 instance did not pan out, but every other instance was followed by a powerful 9-month rally. The “smallest” rally over the next 9 months was the 13.3% gain in ’84-’85. Those are some very strong moves. Instances are low, but the breadth thrust certainly seems to favor the bulls.
Want research like this delivered directly to your inbox on a timely basis? Sign up for the Quantifiable Edges Email List.