As we approached the close I noted on Twitter (@QuantEdges) that the Quantifiable Edges Capitulative Breadth Index (CBI) was starting to spike. And the closer we got to 4pm EST, the higher it got. At the end of the day, the CBI finished at 10, which is a level I have long considered bullish. The combination of a 10+ CBI and a 50-day closing low is something I have shown in the past to be bullish for both the short and intermediate-term. The study below is taken directly from the CBI Research Paper, which I recommend checking out if you have not read it before, or reviewing some of the tables and charts to get a deeper understanding of market action both during and after such broad, strong, selloffs as we are currently seeing.
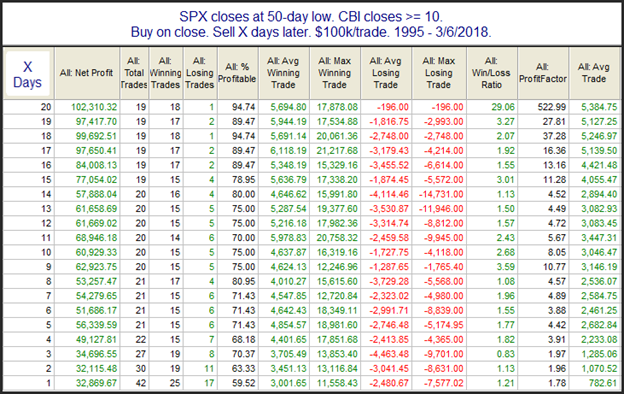
These are very appealing results, from Day 1 right through day 20. And 20 days out there was just one loser and it only lost 0.2%. Meanwhile, the average gain of the other 18 instances was a sizable 5.7%. The CBI is suggesting we are in a bottoming process right now, and that the market is likely to move higher in the coming days and weeks.
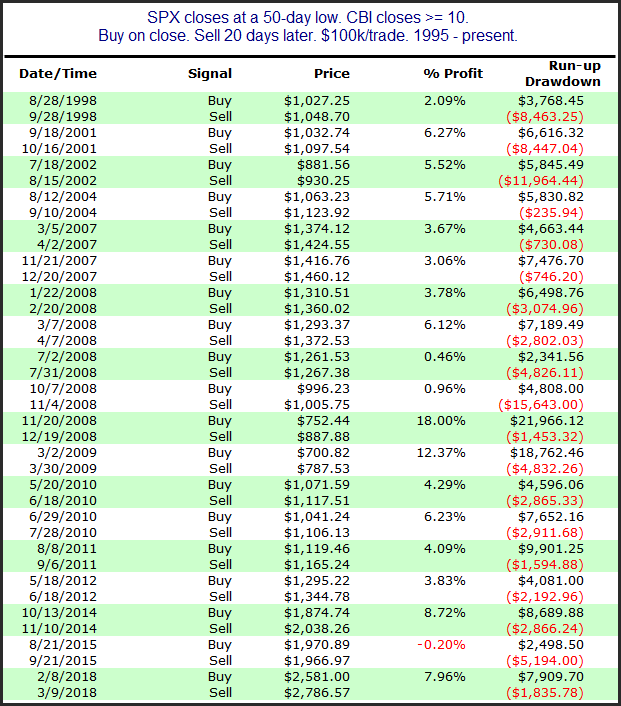
Update: Below is the full list of instances along with their 20-day returns for those traders that wish to see the details.
Want research like this delivered directly to your inbox on a timely basis? Sign up for the Quantifiable Edges Email List.