It is notable that the Quantifiable Edges Capitulative Breadth Indicator (CBI) closed at 10 on Thursday. Below is a study that shows other times the CBI reached 10 while the SPX was above its 200ma.
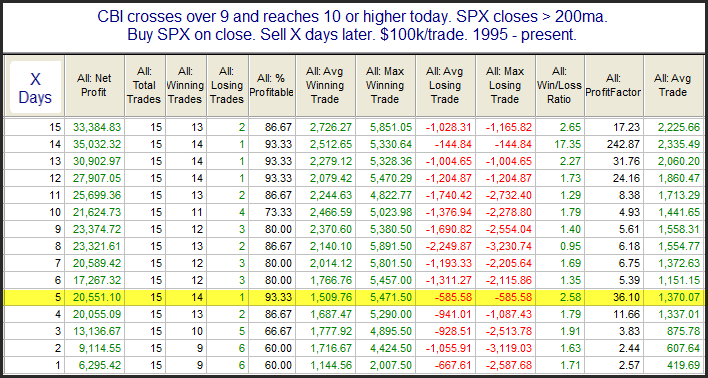
A very high percentage of instances closed higher when looking out 4 or more days. The numbers certainly seem to point to a bullish edge. Below is a profit curve that assumes a 5-day holding period.
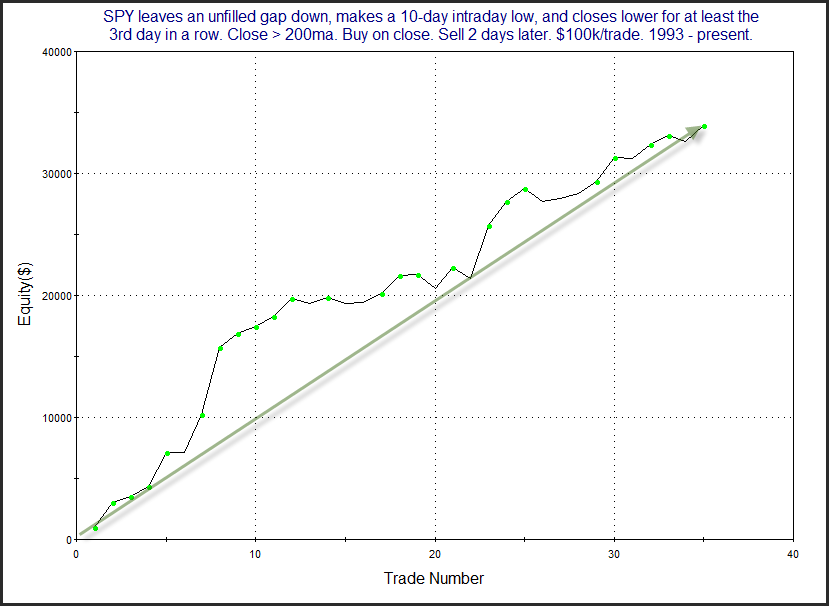
As you can see, the lone loser was the 1st instance, which took place in 1996. Overall, the curve looks great. We’ll see if the historical tendency can overcome the trade war negatives. There is a lot that is strongly oversold and overdue a bounce, and that is what the CBI tells us.
Want research like this delivered directly to your inbox on a timely basis? Sign up for the Quantifiable Edges Email List.