Yesterday I decided to examine performance of XIV during the last few days of the year. The thought was that we are now in a time period that is generally regarded as seasonally bullish. Additionally, volume and volatility are often light this week with many traders on vacation. So I thought with low volatility and bullish seasonality, it could be a bullish time for XIV (the inverse-VIX etf). I checked. Here is the table from yesterday…
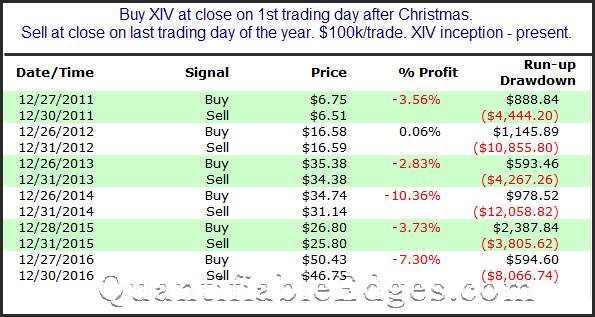
These numbers certainly do not look bullish. They could even be viewed as bearish. Even the lone “winner” saw XIV undergo a drawdown of nearly 11% before closing up $0.01.
So is there a bearish edge? One person suggested I also look at ZIV, which looks at medium-term volatility measures, rather than short-term.
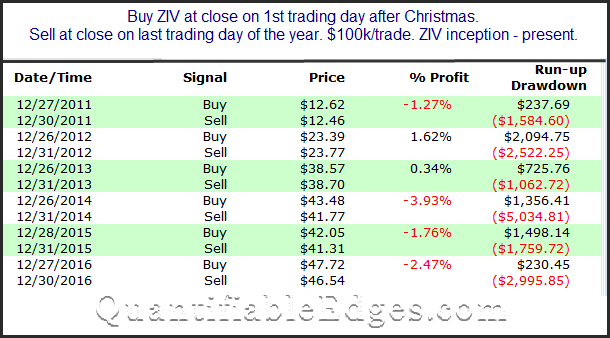
These results are also weak, but not nearly as bad as XIV. Let’s also consider how SPX has done.
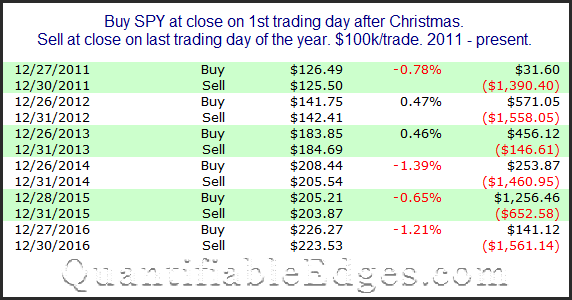
It has been a fairly tough time for SPX over the last few years. So XIV struggling during the same times is not a big surprise. If someone were to examine the last 6 years, they might believe there is a downside edge. I’m not terribly comfortable with such a small sample size. A look at a longer-term chart and stats for SPX might show why.
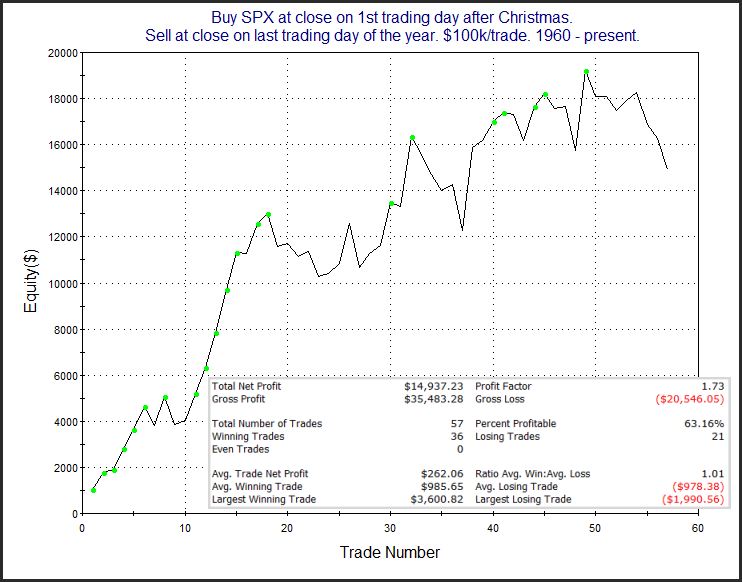
It’s been a bad run the last few years. But suggesting there is a downside edge sure seems like a stretch for SPX.
Back to XIV…my original test examined performance over the last few days of the year. With volatility typically low, and seasonality generally regarded as bullish, I hypothesized there could be a strong bullish tendency for XIV. The results certainly refuted that hypothesis. But I am not of the opinion that they are great proof of an outright bearish edge for XIV.
Want research like this delivered directly to your inbox on a timely basis? Sign up for the Quantifiable Edges Email List.