Friday the employment report will be released about an hour before the NYSE open. Employment days have an interesting history and they have contributed to some worthwhile studies over the years. Below is a chart of SPX performance on Employment Days going back to 1993.
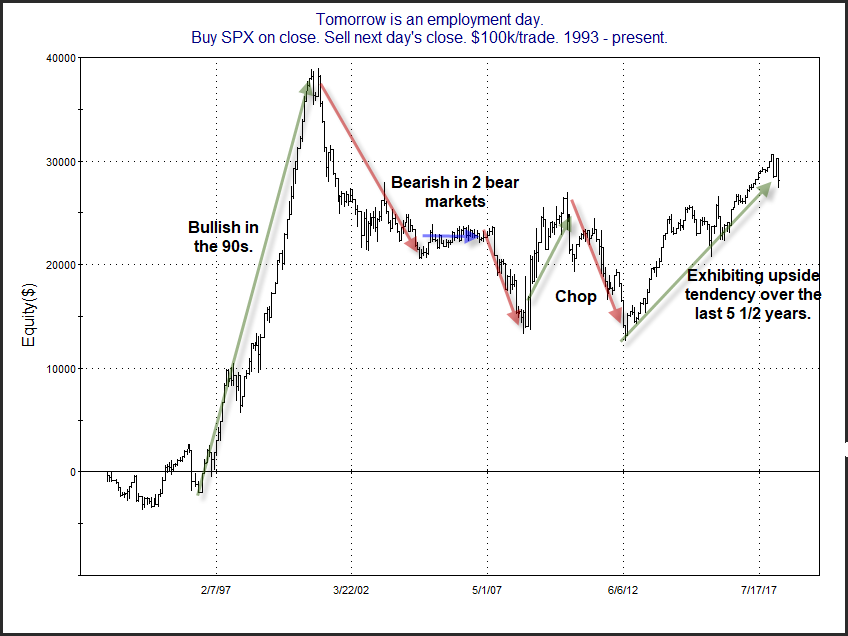
What I find interesting about the chart is that Employment Days have shown such streaky performance – and the streaks lasted a long time. While it’s a bit unusual to see such abrupt changes in market dynamics, it does serve as a nice reminder that such changes are always possible. And with two of the last three employment days seeing a 2% decline in the SPX, perhaps dynamics may be changing again. I will note that employment days are often volatile, and that has been especially true in 2018. The 4 employment days in 2018 have posted the following results: +0.7%, -2.1%, +1.7%, -2.2%. In other words, it has been a market mover. Be ready.
Want research like this delivered directly to your inbox on a timely basis? Sign up for the Quantifiable Edges Email List.