
I am excited to introduce the Quantifiable Edges Hypothetical Correlation Tool. I find a lot of people understand diversification, but few grasp how important correlation is when choosing diversifiers. Combining strategies that don’t move in lockstep is a huge key for improving the risk and return of the whole. It’s easy to say “diversification works.” It’s much harder to grasp why, or to see how much. Hopefully our new Hypothetical Correlation Tool will help make that clearer.
The Hypothetical Correlation Tool lets you define a handful of “models” (each just an expected return and a volatility), choose how correlated they are, decide how much of each to hold, and then watch a Monte Carlo simulation play out thousands of hypothetical futures. It reports the blended portfolio’s compound return, volatility, Sharpe ratio, and worst drawdown, draws the growth of $10,000, and even shows you which models to overweight or underweight to maximize risk-adjusted return. Here is a quick look:
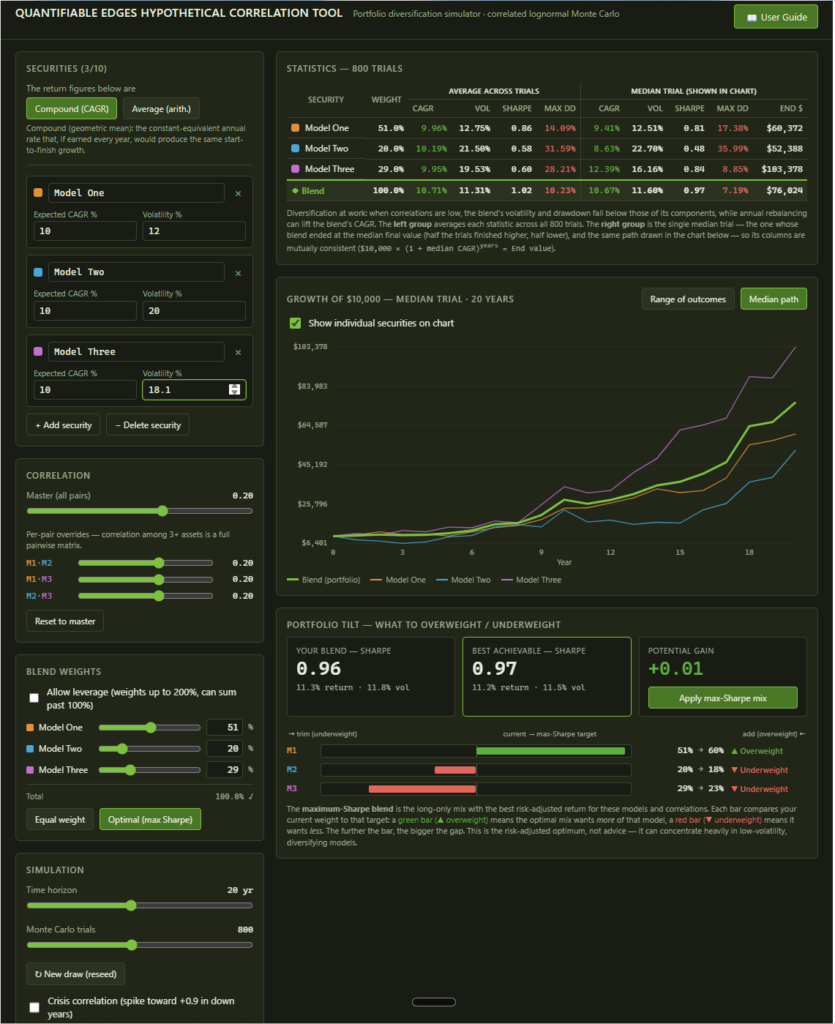
A few things you can explore in about two minutes:
- Drag a correlation slider from +1 toward −1 and watch a blend’s volatility melt away while its return holds up.
- Flip on “crisis correlation” to see why diversification tends to fail exactly when you need it most.
- Hit “new draw” a few times to feel how much any single backtest is just luck.
- Check out the “User Guide” (button top right) for more detailed instruction on how to use the tool.
Note: These are not real returns and not a forecast of any strategy. Every number it produces is a hypothetical simulation generated by a mathematical model, for educational purposes only. It’s built only to illustrate the mechanics of diversification and correlation.
I’ll be doing series of posts and short demos where I will use the tool to walk through specific ideas. These include the rebalancing bonus, the limits of diversification in a crash, and the math of leverage. I hope you like the tool. Stay tuned for the first few mini-demos!
To access the tool you simply need to login to Quantifiable Edges. (Even an old expired trial will work.) Once logged in, simply look for the Correlation Tool under the “Extras” menu item. If you don’t have a Quantifiable Edges login, you can sign up for the Correlation Tool (free) here.
Want research like this delivered directly to your inbox on a timely basis? Sign up for the Quantifiable Edges Email List.
How about a free trial to the Quantifiable Edges Gold subscription?
