
With the calendar moving from October to November, it has now entered its “Best 6 Months”. The “Best 6 Months” tendency was first published by Yale Hirsch, founder of the Stock Trader’s Almanac, in 1986. The concept behind the “Best 6 Months” is simple. Seasonality suggests that over the last several decades the market has made a massive portion of its gains between November and April. And during the remaining 6 months, it has generally struggled to make headway.
Additionally, the market shifted into the 3rd year of the Presidential cycle. Here at Quantifiable Edges we measure the Presidential Cycle years from November – October rather than January – December. That allows the cycle years to better match up with the elections, which take place in early November. It also makes for easy evaluation when combining it with the “Best 6 Months” cycles. The 3rd year of the Presidential Cycle has been a strong one.
When the Best 6 Months and the 3rd Year of the Presidential Cycle have been active at the same time, the results since 1960 have been outstanding. In the table below I have listed out each instance.
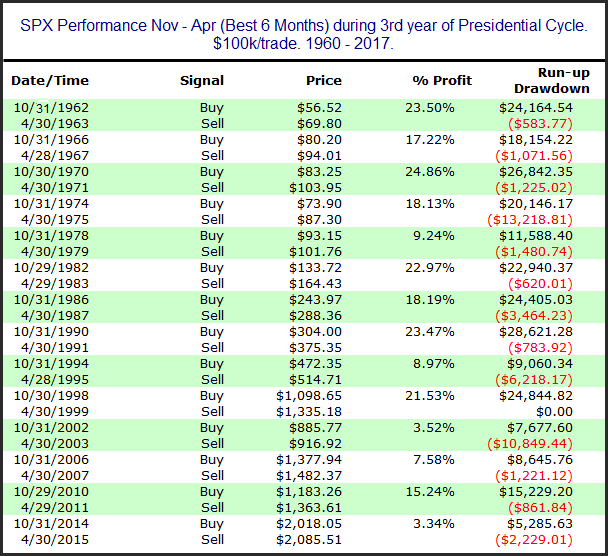
All 14 instances since 1960 have shown gains. Of course there have been drawdowns along the way. The 1974-75 period saw SPX pull back 13.2% from its October closing price before rebounding and finishing April 18.1% above the October closing price. And in 2002-03 there was a 10.85% drawdown from the October close before finishing April 3.5% above it. But overall the stats have been incredibly lopsided. The average 6-month period saw a net gain of 15.5%. The average run-up (from the October close) was 17.7% and the average drawdown just 3.1%. Long-term seasonality does not get any better.
Much more information is available on these indicators in the Quantifiable Edges Market Timing Course. (Get 30% off with the coupon code “November” between now and Monday, 11/5.) Also included in the course are price-based indicators that combine very well with the seasonals, along with possible long-term approaches to utilizing different combinations of price and seasonality. Code, supporting spreadsheets, and access to pages with indicator updates are also included in the course.
Want research like this delivered directly to your inbox on a timely basis? Sign up for the Quantifiable Edges Email List.
