As we head towards the summer, the stock market has two long-term cycles converging that suggest it could be a rough ride. The 2 cycles are the “Best 6 Months” and the “Presidential Cycle”. I cover both of these cycles in detail in the Quantifiable Edges Market Timing Course. Here I will show how the market has performed historically when these two cycles have been in unfavorable phases at the same time.
The “Best 6 Months” cycle was originally published by Yale Hirsch of the Stock Traders’ Almanac. It notes that the market has performed substantially better between November and April than it has from May to October. In fact, a massive portion of the total market gains over time have occurred just in the November – April period.
The Presidential Cycle looks at the 4-year presidential term. The basic idea is that the market performs better during years 3 and 4 of a presidential term than it does during years 1 and 2. When a new US president comes into office, he will often spend much of the 1st year discussing what a bad job his predecessor did, and how tough times are upon us. This allows him to push through policy changes. These changes will often take up much of the 1st two years, and there tends to be significant arguing about whether they are positive changes or not. In general, the 1st two years have a fair amount of turmoil, and this is often reflected in the action of the stock market. Years 3 and 4 the big policy changes are over with and the president is thinking about re-election. Therefore, the rhetoric will change from negative to positive. The improved mood will often be supportive of stock market rallies. One exception to the Presidential Cycle basic rules is that Year 1 has not been negative when we have a 2nd term president. He’s not going to tell you how bad the last guy was, because it was him! So the unfavorable periods of a Presidential Cycle are: Year 1s of a 1st-term president and all Year 2s.
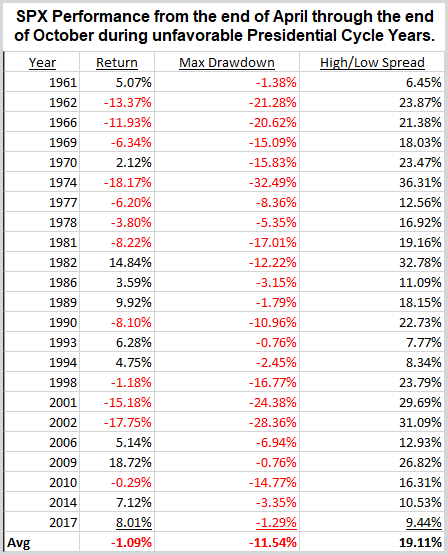
The end of April is upon us. And the market will therefore be facing the “Worst 6 Months” during an unfavorable Presidential Cycle year. The table below shows how the SPX has performed during all such years since 1960.

Eleven years finished higher and twelve lower for an average loss of just over 1%. But what was most interesting was the wild rides the market experienced during these 23 years. The average drawdown from the close of April entry point is -11.54%. And the last column is very eye-opening. This looks at the difference between the max run-up and the max drawdown over the 6 month period to see how wide of a range the SPX traded in. On average, the market saw a high-low range of 19.11% during the 6-month periods. That is exceptionally large. And only 4 of the 23 instances failed to see a range of at least 10%! If seasonal cycles have any say, the market could be in for a wild ride over the next 6 months. Traders may want to be prepared for volatility this summer!
Traders can learn a lot more about these indicators, and how they combine with some of our favorite long-term price action based indicators in the Quantifiable Edges Market Timing Course.
Want research like this delivered directly to your inbox on a timely basis? Sign up for the Quantifiable Edges Email List.
