Tuesday posted the 1st IBD Follow Through Day (FTD) since the rally began. Unusual about this FTD is that it occurred in conjunction with SPX making a new 20-day high. The study below examines other times a 20-day high was accompanied by a FTD.
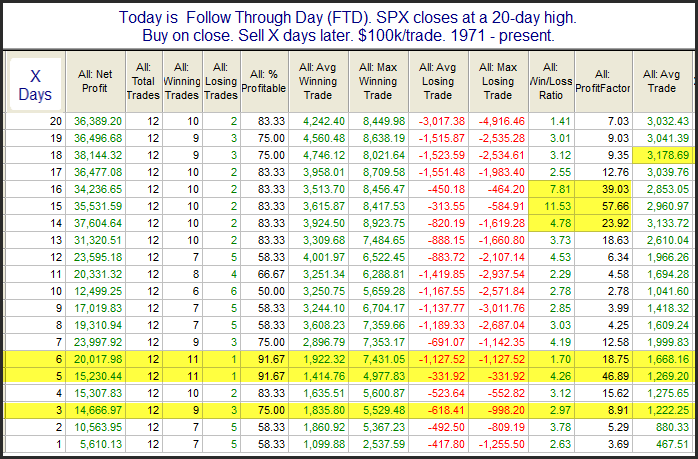
Results here are impressive over both the short and intermediate-term. To get a better feel for the short-term returns I have listed the instances below.
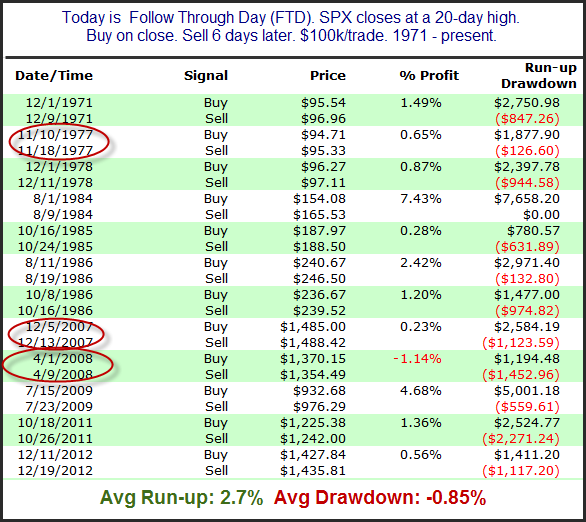
The run-up to drawdown ratio here is quite impressive. I’ll also note that 9 of the 12 instances went on to have “successful” rallies. (“Success” means it either hit a new 200-day high or at least rose 2x as much as it had already risen off the bottom.) The 3 instances whose rallies did not succeed (circled in red) all saw run-ups of at least 2% before they eventually rolled over and made new lows.
A summary of some of my past FTD posts can be found here. Or for the complete list of past FTD studies click here.
Related Quantifiable Edges Studies
- IBD Follow Through Day With a 20-Day SPX High: Bullish Edge Study
- IBD Follow Through Days Quantified: Summary of the 4-Part Study
- IBD Follow Through Days With Moderate Breadth: Only 20% Succeed
- IBD Follow Through Days: Are They Actually Predictive? (Part 1)
Want research like this delivered directly to your inbox on a timely basis? Sign up for the Quantifiable Edges Email List.