Over the weekend, I decided to run some new studies based on the Quantifiable Edges Capitulative Breadth Indicator (CBI). As I tweeted out near the close, the CBI reached 9 on Friday. Historically, I have viewed 10+ as the level that really gets me excited about a potential bounce. I decided to examine market performance other times the SPX closed at a 20-day low and the CBI reached a level of X of higher. In the study below I hold the market position until the CBI returns to 3 or lower.
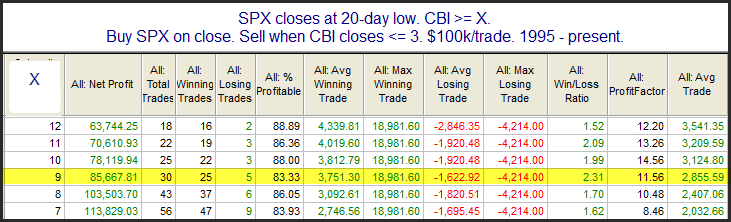
As you can see, results when it hits anywhere 7 or higher are fairly reliable. I have highlighted 9 above since that is the current setup. I also generated a profit curve using 9+ as the entry trigger.
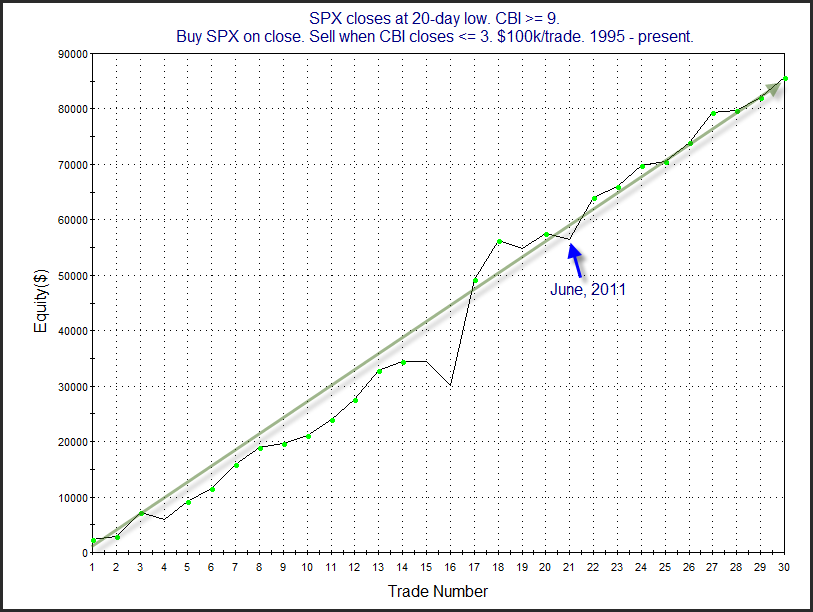
The curve certainly seems to support the idea of a bullish edge. I noted the last loser on the chart, which occurred in June of 2011. While historical odds would look a bit better with a slightly higher CBI, the current reading of 9 has been enough that a bounce was often seen. We may already be seeing that bounce begin this morning. For those that would like to learn more about the CBI, I recently wrote a detailed research paper about it. Additionally, there are a large number of studies about the CBI that can be found on the blog.
Want research like this delivered directly to your inbox on a timely basis? Sign up for the Quantifiable Edges Email List.