
Updated Look At Opex Week Broken Down By Month

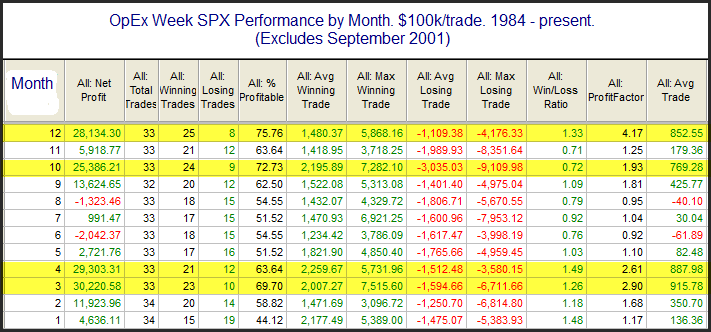
I’ve noted a number of times that Op-ex week in general is pretty bullish. March, April, October, and December it has been especially so. S&P 500 options began trading in mid-1983. The table below is one I have showed in March each of the last several years. It goes back to 1984 and shows op-ex week performance broken down by month. All statistics are updated.
 

2017-03-13


While December has been more reliable, March op-ex week has seen the most in total gains. Traders may want to keep this in mind this week, and refer back to the table in future months.


Want research like this delivered directly to your inbox on a timely basis? Sign up for the Quantifiable Edges Email List.

About the author:

Rob Hanna is the founder of Quantifiable Edges, a quantitative market research service he has run since 2008. His research focuses on statistical analysis of U.S. equity markets. In 2009 he published "The Quantifiable Edges Guide to Fed Days," available on Amazon. He was named the 2024 recipient of the National Association of Active Investment Managers (NAAIM) Founders Award and has since joined the NAAIM Board of Directors. Rob also works with Capital Advisors 360 as an investment advisor representative, where he utilizes quantitative and volatility-based models. Follow him on X / Bluesky / StockTwits / Facebook / Substack