
Implications of a Persistently Stretched VXO

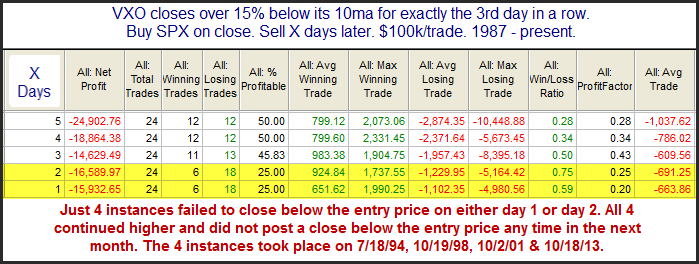
Both the VIX and the VXO have been extended to the downside in recent days. Such stretches suggest a collapse in fear among investors. The study below was last seen in the 12/27/13 blog. It looks for stretches of 15% or more that have persisted for three days.
2014-02-13 image1

Based on the stats table there appears to be a downside inclination. The note at the bottom of the study is especially interesting. Nearly every case has experienced an almost immediate pullback, but those that didn’t went without pulling back for a long time.


Want research like this delivered directly to your inbox on a timely basis? Sign up for the Quantifiable Edges Email List.

About the author:

Rob Hanna is the founder of Quantifiable Edges, a quantitative market research service he has run since 2008. His research focuses on statistical analysis of U.S. equity markets. In 2009 he published "The Quantifiable Edges Guide to Fed Days," available on Amazon. He was named the 2024 recipient of the National Association of Active Investment Managers (NAAIM) Founders Award and has since joined the NAAIM Board of Directors. Rob also works with Capital Advisors 360 as an investment advisor representative, where he utilizes quantitative and volatility-based models. Follow him on X / Bluesky / StockTwits / Facebook / Substack