I have seen a fair amount of hubbub about the Russell “Death Cross” that is happening today and the potential bearish implications for the market. A “Death Cross” is a catchy (though perhaps not terribly accurate) term for when the 50-day moving average of a security cross below its 200-day moving average. It is being promoted as a warning of a potential bear market. Of course all bear markets will see this happen at some point, because a bear market is an extended decline. But the real question when considering the implications of the Death Cross are whether it serves any value in predicting a bear market. To answer this I did an examination of past Russell Death Crosses, and what they meant for the S&P 500.
Both of my data sources show Russell data back to late 1987. And since I need 200 days to calculate a 200-day moving average, the earliest the study could look back to was 1988.
Here is the list of all Russell Death Crosses and how the SPX performed from the time of the initial cross until the Russell Death Cross was no longer in effect (meaning the 50-day moving average closed back above the 200-day moving average).
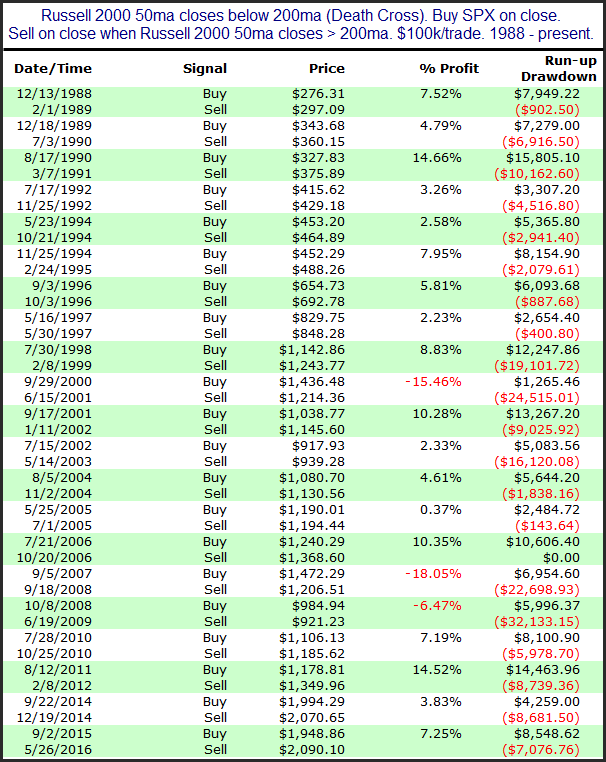
Eighteen winners. Only three losers. So 86% of the “predictions” were wrong. Here is a look at the summary stats and a profit curve for this setup.
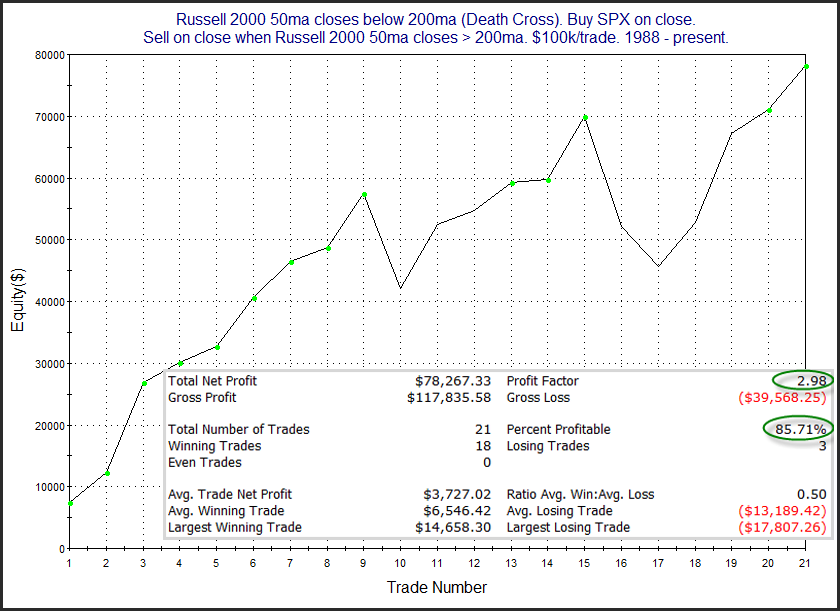
I am having a hard time seeing the Russell 2000 Death Cross as a bearish indication. You would have a much easier time convincing me this is a bullish indication for the intermediate-term.
Want research like this delivered directly to your inbox on a timely basis? Sign up for the Quantifiable Edges Email List.