The Quantifiable Edges Duration Rotation Model is currently available to new subscribers. Subscription information can be found here, and a detailed webinar recording is also available. The webinar was given earlier this month. This post is follow-up information with additional research.
When I designed the Duration Rotation Model in early 2020, I did so using data up through 2019. I settled on 3 different durations with which to implement the model. Those durations, and the associated ETFs, can be found below:
- 20 year treasuries (TLT)
- 7-10 year treasuries (IEF)
- 1-3 month t-bills (SHV)
One limitation of the design was that I could only run tests back to 2007. This is because SHV’s inception was January of 2007. Still, as I discuss in the webinar, I took care to make sure the system was robust, and even tested on alternative hypothetical data designed to mimic a bond bear market. I began trading the model near the end of May 2020. At the end of August I expanded the trading to many of my Eastsound Capital Advisors clients. Results thus far have been inline with what I had hoped for.
After attending the webinar, a prospective client sent me daily total return data for 30-year, 10-year, and t-bills since 1990, and asked me to see how the system might have worked using these instruments going back further in time.
The data showed close correlation to ETFs I use for the model, so it appeared to be a good way to test the effectiveness going back further. Before going back further in time, I decided I needed to compare returns using his data vs returns using the standard data and ETFs since 2008. The chart below shows growth of $1000 since 12/31/2007 for 1) 30-year bonds (blue), 2) Duration Rotation using the new proxy data (orange), 3) TLT (grey), and 4) standard Duration Rotation (yellow). Note for all tests I used the standard parameters for Duration Rotation. There were no adjustments made or optimizations run for any of these tests.
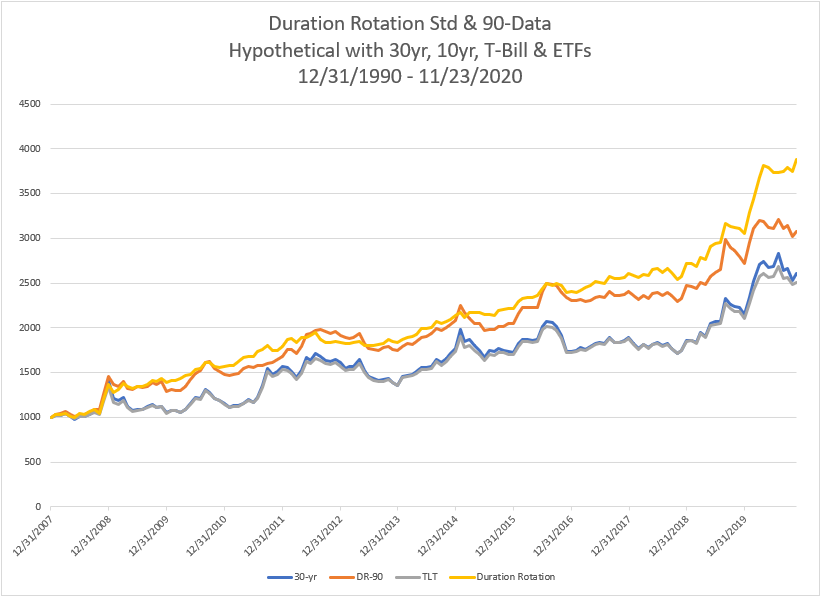
Several things to note about the chart:
- 30-yr and TLT show strong correlation. 30-yr outperformed very slightly over the long run. It certainly appears to make a suitable proxy for looking back further in time.
- DR-90, which is the Duration Rotation model using the proxy data back to 1990, outperformed TLT and 30-yr quite nicely. Keeping up with them while lowering the drawdown is an objective of the model, so this was encouraging.
- Drawdowns were larger using the proxy data than using the standard ETFs, which hurt returns, especially recently. In comparing the trades, it appears this is because SHV tends to trigger more often than the t-bill proxy.
- The outperformance during the live period over the last several months is primarily due to higher use of SHV. I find it encouraging that the actual securities manage to perform favorably vs the proxy in both backtested and live environments.
I decided to look at drawdowns in the Duration Rotation Model using proxy data vs ETF data a little closer. A comparison can be seen in the chart below.
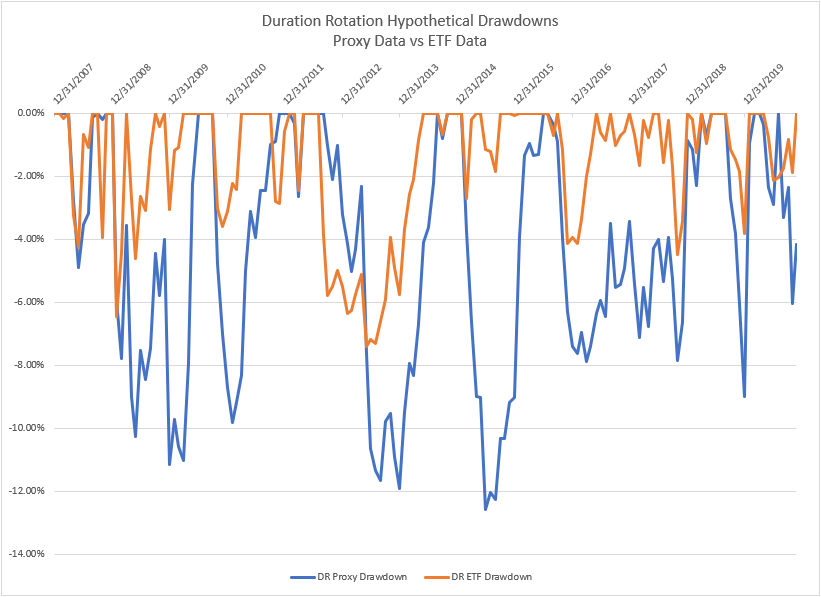
What we see here is that it is not just the “max drawdown” that improved, but nearly every drawdown has been reduced with the standard ETFs vs the proxy data. I don’t have a great explanation for why SHV tends to work more effectively than the t-bill proxy data, but it certainly seems to.
Overall, the proxy data appeared suitable, and the proxy model appeared comparable, though perhaps not quite as good, as the standard model. Therefore, I went ahead and ran the model back to 12/31/1990, and compared the returns to the 30-yr treasury data. (This was a nervous moment, since you never know what will happen when you add 17 years of new data to an already established model.) Results are below.
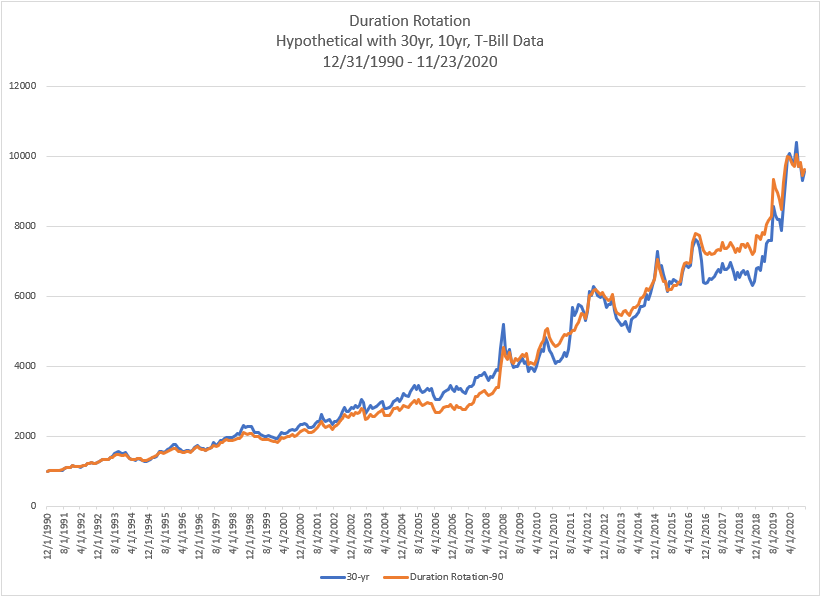
This was everything I could have hoped for. The Duration Rotation Model, even using the proxy t-bill data rather than SHV, would have managed to keep pace with TLT and provide reduced drawdown over the long run. Overall, these additional tests have provided me even greater confidence in the Duration Rotation Model.