Tuesday’s action caused SPY to close in an interesting position. Traders could look at the chart and say it is “short-term oversold” due to the fact that it closed at a 5-day low. They might also say it is “short-term overbought” since it closed above its 10-day moving average. I have found that edges often arise when something is short-term overdone in one timeframe, but overdone in another direction in another timeframe. The study below looks at the current discrepancy.
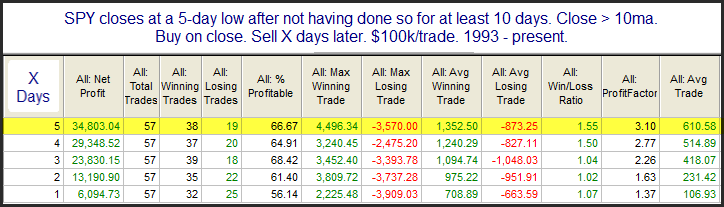
Results here suggest a solid edge over the next 1-5 days. Below is the 5-day profit curve.
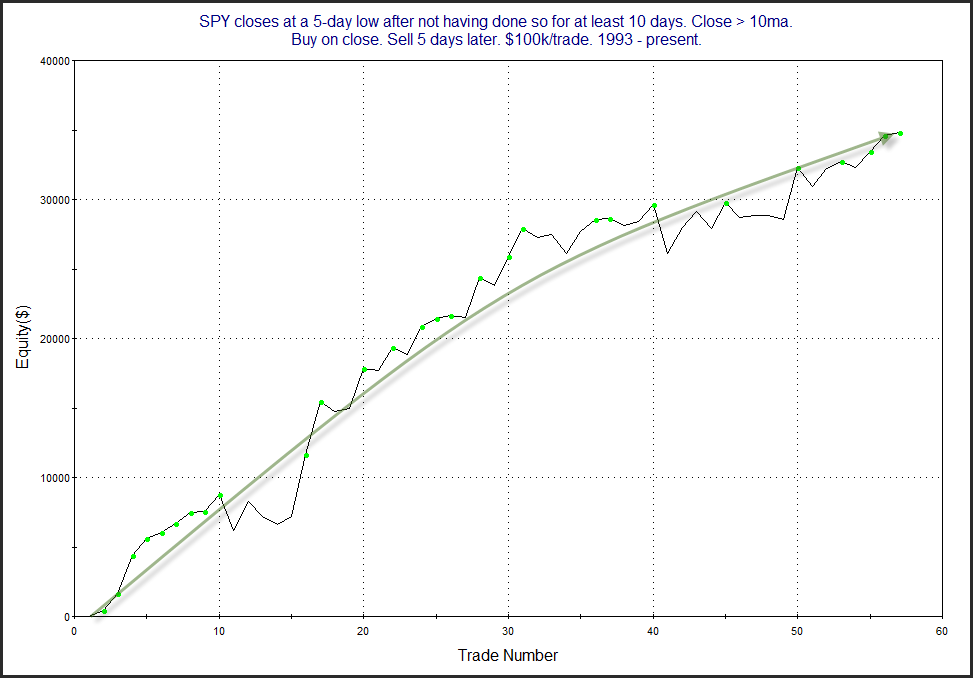
The strong and persistent upslope is impressive, and serves as some confirmation of the bullish edge suggested by the numbers. Traders may want to keep this in mind when setting their bias for the next few days.
Want research like this delivered directly to your inbox on a timely basis? Sign up for the Quantifiable Edges Email List.
How about a free trial to the Quantifiable Edges Gold subscription?