I have begun sharing one of the Quantifiable Edges Seasonality Calendars each month. Last month, we looked at long-term treasuries. This month the calendar that caught my eye was the NASDAQ Composite Index.
The Quantifiable Edges Seasonality Calendar uses multiple systems to measure historical performance on similar days to those on the upcoming calendar. The systems look at filters like time of week, month, year and so forth. Over the long run, staying out of the market on days that do not appear in green, would have been beneficial. To appear in green the date needs to show a historical Win% of 50% or more and a profit factor of 1.0 or more.
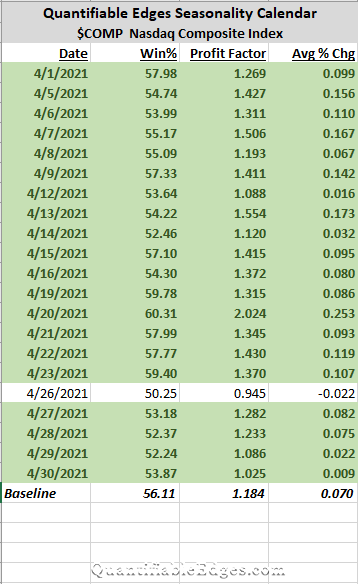
Obviously the NASDAQ stood out because its Calendar is almost all green. But not only do we see mostly green this month, I’ll also note that almost every day up until April 23rd we see numbers above the “baseline”. The baseline is simply NASDAQ stats over about the last 10 years. So the next 3 weeks we see that NASDAQ seasonality is both positive, and mostly better than average. Traders may want to keep this in mind along with other factors they consider as they establish their market outlook over the next few weeks.
Want research like this delivered directly to your inbox on a timely basis? Sign up for the Quantifiable Edges Email List.
How about a free trial to the Quantifiable Edges Gold subscription?