No time for research tonight. I spent the night at the Garden. Yeah Celts.
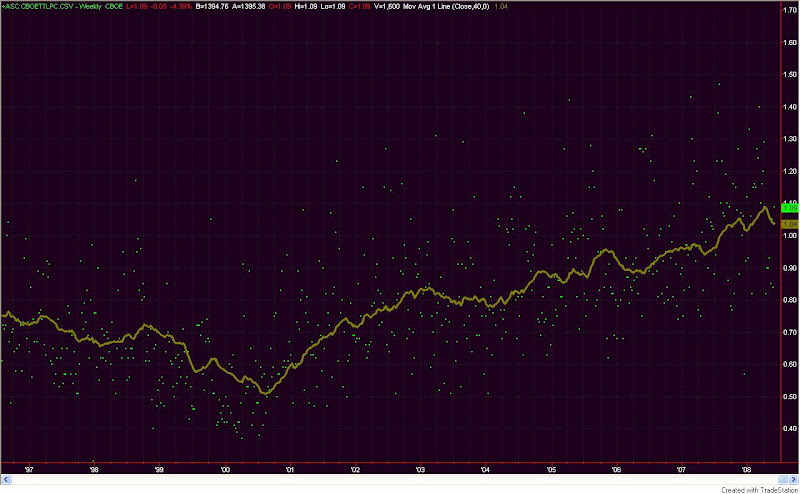
In lieu of a study, I instead prepared a chart of the CBOE Total Put/Call Ratio. One thing traders need to keep in mind when looking at certain indicators is that they may change over time. The put/call ratio is a prime example of that. The chart below is weekly. The green dots are the Friday closing prices of the put/call ratio and the brown line is a 40-week moving average.
Often times I hear traders refer to absolute levels in put/call ratios as if they are significant. What you can see by looking at the chart above is that “significant” has change over time. From ’97 to ’02 a “spike” in the ratio over 1.00 could have been viewed as significant. A trader seeing such a reading may conclude that fear among option traders was running high. Now a reading of 1.00 is below average. A reading of 0.5 would sure be significant, though. In 2000 it was about average. Strategies that may have been developed 7 or 8 years ago that looked for a move to a certain number are now likely obsolete. That doesn’t mean the put/call ratio has stopped working as an indicator, though.
The issue lies in the fact that the popularity and use of options for traders and institutions has changed over time. It will continue to change. To adjust for this you should normalize the readings over a certain time period and then compare the current readings to “normal”. There are a number of ways to do this. Comparing to a moving average using percentages is a simple and effective one. Another way to normalize the put/call ratios would be to use Bollinger Bands (try varying lengths). The specific method is not terribly important. The fact that it is done is important if you don’t want your strategy or study to become obsolete.
