The chart below is from this weekend’s QE subscriber letter. It is one I have updated frequently the last few months. It looks at compound performance of two opposing strategies. The blue line represents a strategy that is invested in the market during weeks that the Fed’s SOMA account value rises. During weeks where the SOMA declines, the blue line is sidelined (earning no interest). The red line takes the opposite approach. It is in the SPX during SOMA contraction weeks, and it is sidelined when the SOMA expands. (The SOMA is the Fed’s System Open Market Account that contains all of its bond holdings.) SOMA changes are released each Thursday, and look at a Thursday – Wednesday reporting week.
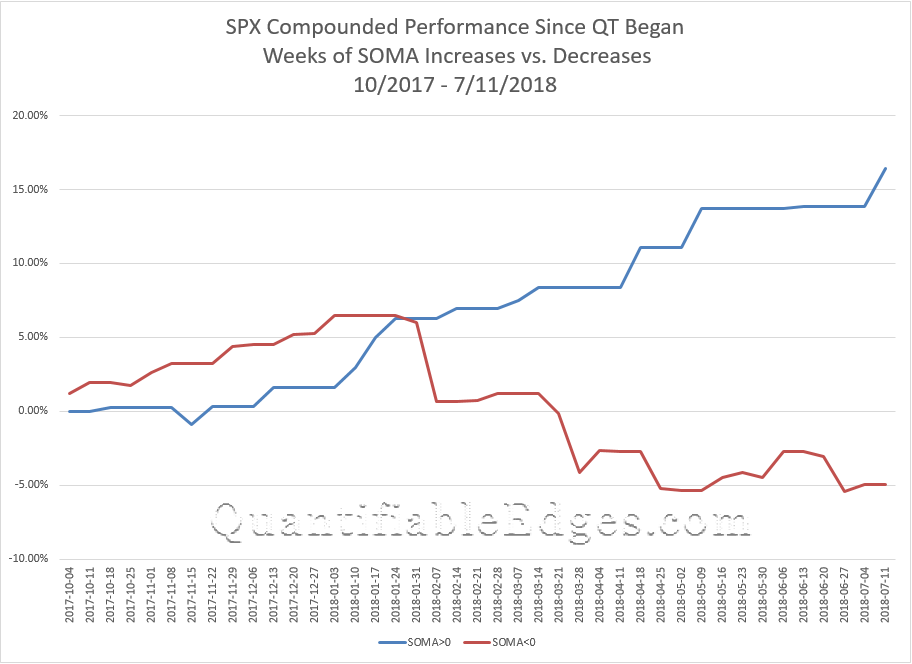
This past week (ending July 11th) saw a mild increase in the SOMA, which appeared to provide just enough opportunity for the bulls to run. Expansion weeks have been positive on a very consistent basis (+16.4% total). Reduction weeks have been choppy and net losers (-4.9% total). The rally this past week again put the blue line at new highs. The last time the SOMA expanded and the blue line did not hit a new high was in November of 2017. The current week (through Wednesday the 18th), I am expecting to see further SOMA increases. But as we close out July and head into August, the Fed’s Quantitative Tightening (QT) program will kick in harder and we should see some sizable SOMA contractions. The expected tight liquidity could make it more difficult for the market to absorb any shocks or bad news. This may open the door for a bearish push, or at least some increased volatility.
For a more detailed discussion of Quantifiable Edges SOMA outlook, you may take a free 7-day trial, where you’ll be able to read this past weekend’s letter as well as next weekend’s.
To learn more about the Fed, its policies, the SOMA, and how it all influences the stock market, check out the free QE research paper, Fed-Based Quantifiable Edges for Stock Market Trading. (This is available with the trial also – no need to sign up for both. Or if you previously registered at Quantifiable Edges, just login, click on “Sub Info” and then look under “Active Resources” to download the paper.)